Introduction
Different colorimetric assays have been developed to determine the protein concentration of samples. The most commonly used methods are the Bradford assay, the Lowry assay and the BCA assay. In this application note we demonstrate how to determine the protein concentration of samples by using the Bradford assay and a BMG LABTECH microplate reader. The Bradford assay is based on the binding of protein to a dye, leading to a shift in the absorbance maximum of the dye. After creating a standard curve of protein solutions with known concentrations, the protein concentration of unknown samples can be calculated. The dye used for the Bradford assay is Coomassie® Brilliant Blue G-250 (Figure 1).
Materials & Methods
- 96 well transparent microplates from Greiner
- BMG LABTECH microplate reader
- Bovine Serum Albumin from Sigma-Aldrich
- Bradford Reagent from Sigma-Aldrich
The Bradford Reagent was bought ready to use. A stock solution of bovine serum albumin in distilled water (10 mg/ml) was prepared as a protein standard. For the measurements, a dilution of bovine serum albumin was done starting with 1 mg/ml. Bradford reagent, 290 μl, was pipetted into a transparent 96 well microplate. 10 μl of the protein dilution was added followed by mixing in the wells. After 5 min of incubation at room temperature, the plate was read at 595 nm or in spectrum mode with the absorbance spectrometer of BMG LABTECH’s microplate reader.
Instrument settings
| Number of flashes:1 |
20 |
| Wavelenth range: | 380-800 nm (or discrete wavelength at 595 nm) |
| Wavelength step width |
1 nm
|
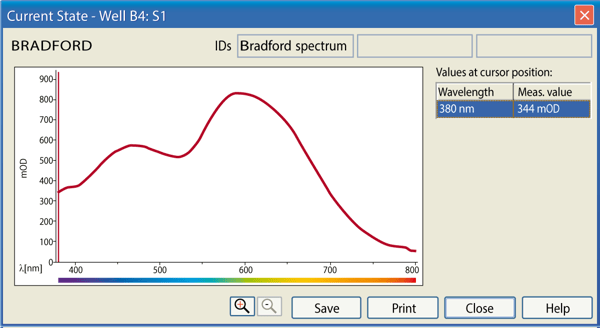
The acidic solution of the Coomassie® Brillant Blue dye has an absorbance maximum at 465 nm. After the addition of protein, hydrophobic amino acid residues and arginine residues bind to the dye. As a result, the absorbance maximum of the dye shifts from 465 nm to 595 nm (Figure 2).
The progress of the measurement can be followed using the Current State Window (Figure 3).
Furthermore, during the measurement, it is possible to magnify a selected well and get information about the measured values over the spectral range (Figure 4).

Results & Discussion
After measurements are taken, the data is transferred to the evaluation software. Pre-defined templates can be used to do the calculations needed instantaneously, i.e. average of raw data, blank correction, performing curve fits, and much more.
For the Bradford assay the blank corrected values are used for the standard curve (Figure 5).
With the help of the standard curve the MARS data analysis software calculates the protein concentration for unknown samples automatically. If the option “path length correction” is used, the measured data is multiplied by a factor that depends on the type of microplate and volume used. With the help of this calculation, the data are normalized to a path length of 1 cm, thereby allowing a comparison to be made between absolute data obtained from a microplate reader with data obtained from a cuvette-based spectrometer.
Conclusion
The Bradford assay was successfully performed on the BMG LABTECH microplate reader. According to the manufacturers protocol, this protein assay is linear in the range of 0.1 – 1.4 mg/ml. Because of its homogeneous and fast nature, the assay is a preferred method to determine the protein concentration of samples.
BMG LABTECH microplate readers offer entirely new possibilities with its spectrometer tool. A whole absorbance spectrum can be read in about 1 sec per well. Furthermore, the new MARS data analysis software allows for the absorbance maximum or minimum to be recognized at once after clicking on the spectral curve. Any wavelength can be selected to give the values for the optical density in any well. The speed of the spectrometer and the easy work-up in the software provide users with unmatched flexibility that can be used to optimize absorbance settings for all experiments.


