Introduction
The aim of cell line development is to create cell lines that are robust, show optimal growth and produce high titers of proteins such as monoclonal antibodies. To this end thousands of cell clones are seeded as single cells and are grown in the wells of a 384-well microplate. Traditionally the high performing cells of such a clone library had to be identified using methods such as Western Blot or ELISA. Both methods are very time consuming and need lots of materials as well as hands-on time.
To overcome these drawbacks the company PAIA Biotech has created a bead-based assay that allows the quantification of cell line secreted protein in a high throughput format. The technology features special 384-well plates (PAIA plates) with a pyramid-shaped transparent protrusion on a black well bottom, which allows separation of beads and detection of fluorescence in solution. Three different monoclonal antibodies were successfully measured in the CLARIOstar® microplate reader from BMG LABTECH.
Assay Principle
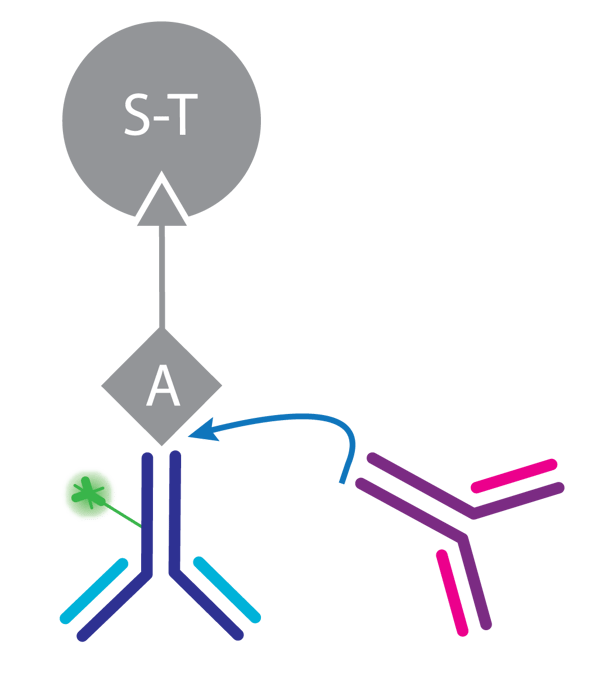
The assay utilizes streptavidin coated capture beads to which a defined amount of biotinylated Protein A is bound. The fluorescence marker, a FITC-labeled human antibody, competes with the analyte for binding to Protein A (Fig. 1).
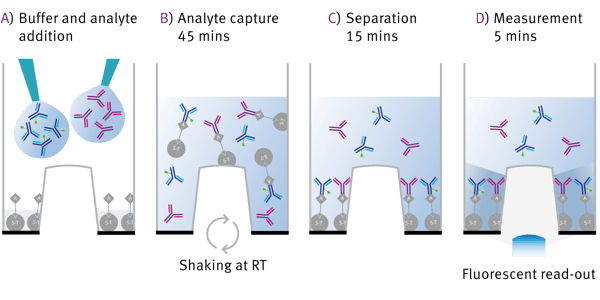
The assay workflow is shown in Fig. 2. Capture beads are already present in the well when buffer and analyte are added (2A). Analyte capture is realized with orbital microplate shaking for 45 min (B). During the separation time of 15 min the beads bound to either analyte or the fluorescence marker will settle down (C). Finally the microplate is measured from the bottom. Only the protrusion in the middle of the well is transparent to allow the fluorescent read-out (D). The more analyte is present in the well, the more FITC-labeled antibody is replaced resulting in a high fluorescence signal.
Materials & Methods
- Competitive human IgG Fc kit from PAIA Biotech including PAIA 384-well microplate
- Orbital plate shaker (e.g. BioShake XP from Q. Instruments)
- Monoclonal antibodies Cetuximab, Rituximab and Panitumumab were purchased from usual commercial sources
- CLARIOstar® microplate reader from BMG LABTECH
Preparation of standard curves
54 µl of PAIA mix containing assay buffer and FITC-labeled antibody is added to each well in which Protein A coupled capture beads have been pre-dispensed. 6 µl of standard at different concentrations is added using an electronic multichannel pipette. As standards three different monoclonal antibodies are used: Cetuximab (registered trade name Erbitux®), Rituximab (registered trade name MabThera®) and Panitumumab (registered trade name Vectibix®).
Shaking and sedimentation
After PAIA mix and standards are added the following shaking and sedimentation program should be applied:
- 45 min at 1800 rpm on an orbital shaker
- 5 min at 1000 rpm on orbital shaker
- 10 min without agitation
CLARIOstar instrument settings
|
Detection Mode: |
Fluorescence |
|
Method: |
Bottom reading |
|
Optic settings: |
Monochromator presets for Fluorescein/FITC |
|
No. of flashes: |
40 |
|
Focus and Gain: |
Need to be adjusted |
Results & Discussion
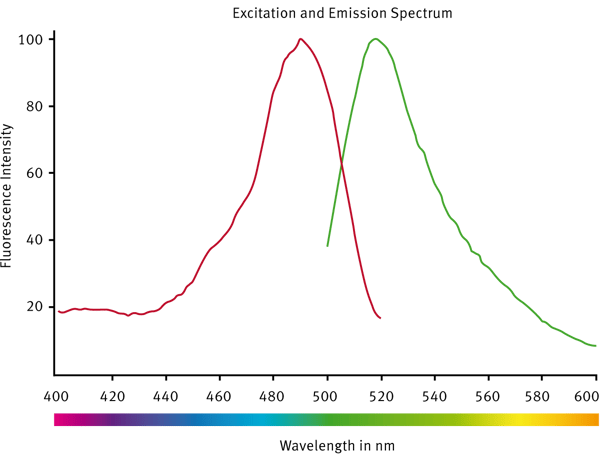
A spectral scan was done in order to see if the typical FITC settings would be appropriate for the assay (Fig. 3).
The scan has shown that the standard monochromator settings for FITC can be used for the PAIA assay (preset fluorescein/FITC). The average CV for each standard concentration with 4 replicates was 3 %.
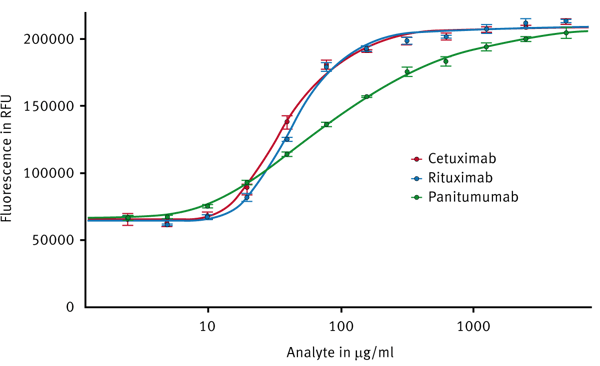
After measuring the assay plate the data can easily be processed with the MARS Data Analysis software. A 4- or 5-parameter fit should be applied (Fig. 4).
Cetuximab and Rituximab, which both are of the IgG1 type, show congruent 5-parameter fit curves indicating similar affinity to Protein A. Panitumumab is an IgG2 antibody and thus exhibits a different behaviour as can be seen by a different curve progression. Thus the assay covers different concentration ranges for IgG1 and IgG2. IgG1 can be quantified from 10-200 and IgG2 from 5-2000 µg/mL.
The PAIA assay can be measured in the CLARIOstar by either using the LVF monochromatorTM or FITC filters. Table 1 shows R2 and LoD values obtained with either configuration.
Table 1: R2 and sensitivity comparison of monochromator and filter measurements.
|
|
Cetuximab |
Rituximab |
Pantumumab |
| R2 5-parameter fit | |||
|
LVF monochromator |
0.9962 |
0.9960 |
0.9997 |
|
Filters |
0.9973 |
0.9964 |
0.9994 |
|
Sensitivity in µg/ml* |
|||
|
LoD monochromator |
10.2 |
13.9 |
6.2 |
|
LoD Filters |
11.5 |
13.7 |
5.2 |
* LoD was calculated using the following formula: LoD = 3 o0 + y0, where y0 is the mean blank signal (substance concentration is virtually 0) and o0 is the standard deviation for the mean blank signal.
Conclusion
The IgG PAIA assay was successfully measured with fluorescence bottom reading on the CLARIOstar microplate reader from BMG LABTECH. The special structure of the PAIA plate is compatible with all BMG LABTECH instruments capable of fluorescence intensity measurements. The competitive assay format is not limited to monoclonal antibody detection but can be extended to a variety of proteins and antibody fragments.


