Introduction
Bone remodeling is the process where bone is continually removed and replaced. Disruption of this process can lead to osteoporosis, characterized by low bone mineral density or bone thickening characteristic of sclerosterosis. Bone remodeling involves the actions of two cell types found in bone, osteoblasts (bone resorption) and osteoclasts (bone deposition). The actions of these two cell types is coordinated by a third type of bone cell called an osteocyte. Sclerostin has now been identified as a molecule expressed by osteocytes that is able to modulate the Wnt-signaling pathway which is important in regulation of bone formation.
Wnt exerts its effect on bone formation by binding to the LRP 5/6 – Frizzled receptor on osteoblasts. This leads to stabilization of intracellular β-catenin and regulation of transcription that promotes bone formation. By binding to the LRP 5/6 receptor sclerostin antagonizes Wnt-signaling and inhibits bone formation. Therefore treatments which block the sclerostin LRP 5/6 interaction could serve as treatments for osteoporosis. In this application note, we show that the CLARIOstar microplate reader from BMG LABTECH can be used to screen for Sclerostin-LRP5/6 binding inhibitors.
Assay Principle
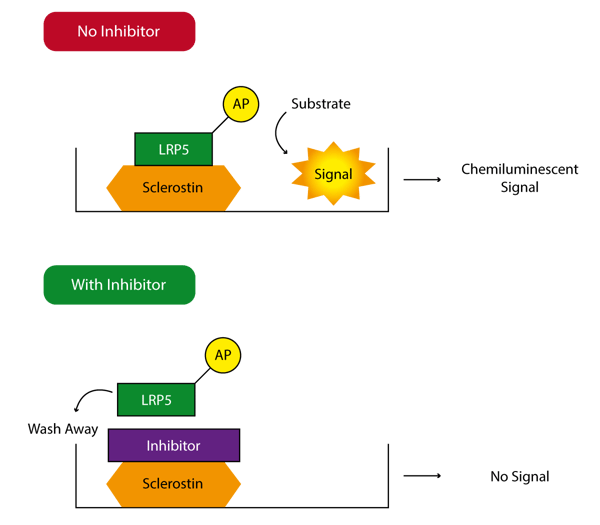
 The Leading LightTM Sclerostin-LRP Interaction Screening System uses LRP5 engineered such that it is linked to the enzyme alkaline phosphatase (AP). Sclerostin is coated on 96-well plates and bound LRP5-AP is detected by the activity remaining after a washing step (Figure 1). In this way, a variety of different compounds can be screened for their ability to disrupt the sclerostin/LRP5 interaction. Since this is a biochemical assay there is no requirement for a cell line or the stable or transient transfection of a reporter gene.
Materials & Methods
- CLARIOstar microplate reader from BMG LABTECH
- Leading LightTM Sclerostin-LRP Interaction Screening System kit (ENZ-61003) from Enzo® Life Sciences
- white 96-well microplate, Costar
Reagents and microplate supplied in the Sclerostin-LRP Screening kit were prepared according to the procedures described in the product manual. The kit contains a positive control (LRP5-AP fusion protein), a negative control (AP concentrate only), and an inhibition control (Acid Green 25). All plate shaking steps employed the CLARIOstar orbital shaking feature. Upon finishing assay preparation and washing steps the alkaline phosphatase substrate was added.
After a 25 minute incubation the chemiluminescence signal was measured in the CLARIOstar.
To determine appropriate monochromator settings an emission scan was performed using the following instrument settings:
| Measurement Method: | Luminescence |
| Reading Mode: | Spectral scan |
| Emission wavelength: | 500 – 600 nm |
| Emission bandwidth: | 20 nm |
| Gain: | 3600 |
| Focal height: |
11.0 |
| Measurement Method: | Luminescence |
| Reading Mode: | Endpoint |
| Measurement interval time: |
1 second |
| Emission wavelength: | 550.0 nm |
| Emission bandwidth: | various |
| Gain: | 3600 |
| Focal height: |
11.0 |
Results & Discussion
The CLARIOstar spectral scan feature allows you to obtain an image of the luminescence emission of your lumiphore at resolution of 1 nm (Figure 2).
 Based on the broad emission spectrum in this experiment we believed that capturing the entire emission spectrum from 500 nm to 600 nm will give best results. The LVF Monochromator in the CLARIOstar makes detecting bandwidths up to 100 nm possible. Using the monochromator setting of 550-100 we were able to collect light from this entire spectral range. Excellent results in the assessment of the inhibitory capacity of Acid Green 25 on the interaction between sclerostin and LRP5 were obtained (Figure 3).
 Table 1 provides a comparison of various monochromator settings to assess the effect of decreasing bandwidth on assay performance parameters.
| Bandwidth (550-) | 100 nm | 90 nm | 80 nm |
| Avg. PC* | 2,216,000 | 2,022,000 | 2,004,000 |
| Assay window | 275 | 254 | 248 |
| Z’ | 0.972 | 0.968 | 0.968 |
Avg. PC* = average luminescence value of positive control
As we would expect decreasing the bandwidth leads to a decrease in RLU which correlates with a slight decrease in assay window. The assay window is the ratio of positive control and negative control. The effect on Z’, however, is negligible.

