Bioluminescence resonance energy transfer (BRET) is an established method to study protein-protein interactions. Most of the research focuses on GPCRs as these receptors play an important role in finding new drug candidates.1
There are several BRET-based approaches that allow the monitoring of protein-protein interaction2such as:
BRET between receptors and ligands3
BRET between receptors and G proteins
BRET between receptors and downstream effectors, such as adenylyl cyclase or ion channels
BRET sensors that follow beta-arrestin recrutiment cAMP BRET biosensors
In this application we will show how a cAMP BRETbiosensorcan be used to monitor ligand binding with the help of the CLARIOstar microplate reader.
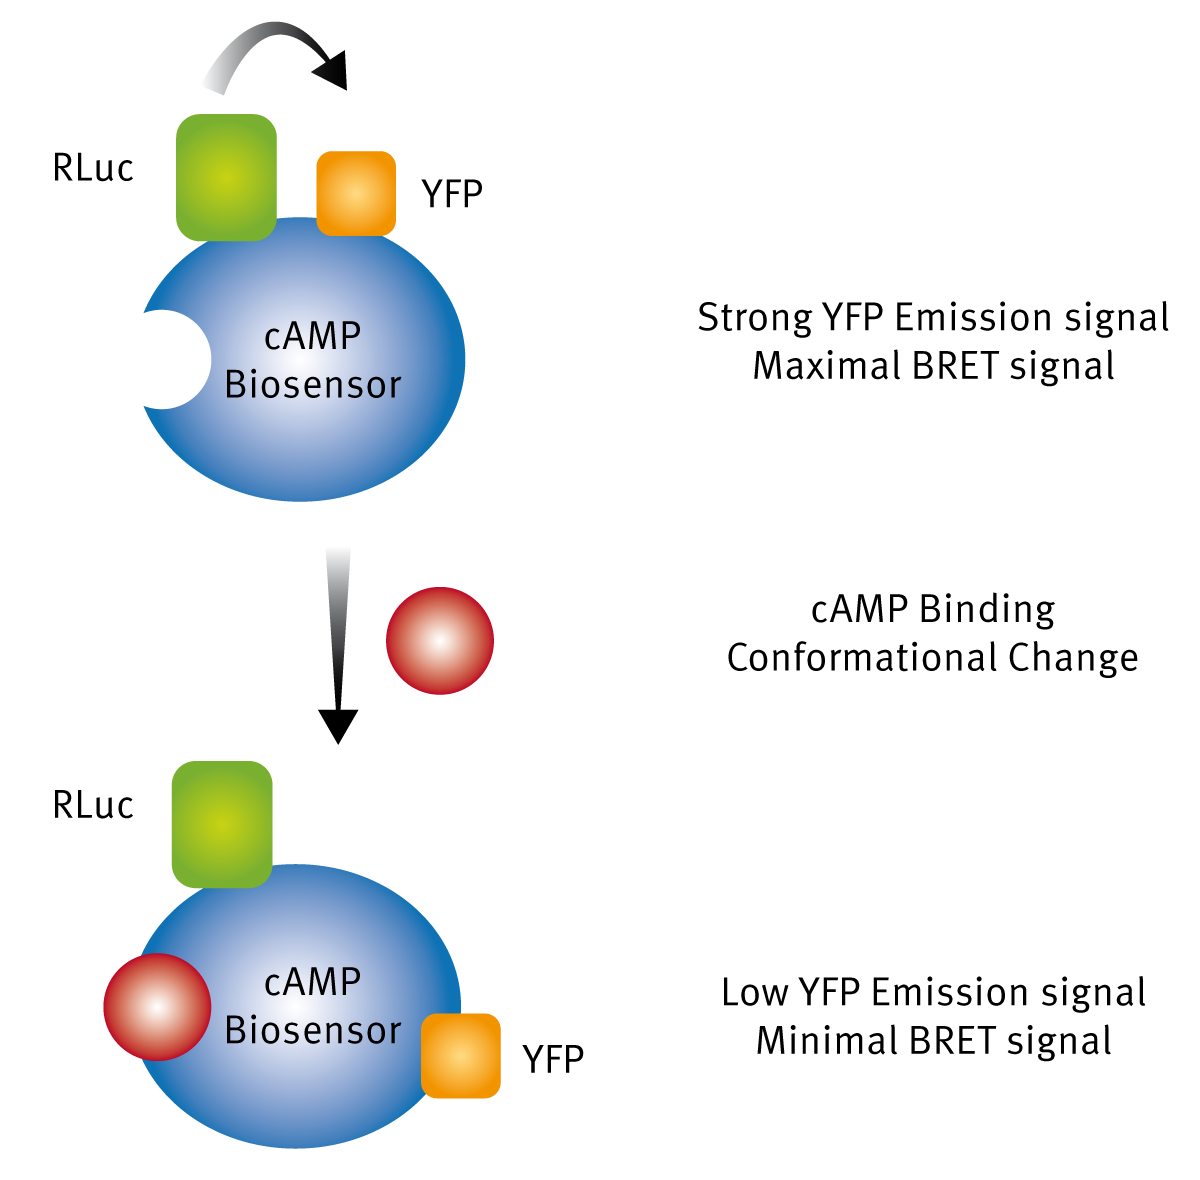
Assay Principle Fig. 1: Assay Principle of detection of ligand binding using BRET1 technology.
The BRET biosensor carries a cAMP binding domain,Renillaluciferase and YFP. The latter two are in close proximity. Once the luciferease is activated by substrate addition (Coelenterazine H) the enzyme emission excites YFP. This leads to a strong emission signal at 530 nm and therefore to a strong BRET signal (Fig. 1). Once a ligand is binding to a GPCR, G proteins are activated and cAMP is generated. Free cAMP will find its binding site and the biosensor will undergo a conformational change leading to a greater distance between Rluc and YFP. The result of that process is no or only weak YFP emission leading to a small BRET signal.
Once ligands are found that are able to effectuate the conformational change, a dose response can be run in order to determine EC50values.
cAMP biosensors were prepared as described in reference 2. Cells were transiently transfected with the fusion plasmids. One day before BRET experiments the cells were seeded into 96-well microplates.
Just select 475-30 and 535-30 nm, the bandwidth is adjustable up to 100 nm
Filters:
Emission filters 475-30 and 535-30 nm
Kinetic settings:
No. of cycles: 10
Cycle time: 90 sec
Measurement time: 0.50 sec
Gain:
3600 for both channels
BRET calculation
Ratio calculation: 535 nm / 475 nm
Average of 4 first measurement points (based on ratio) = A0
Average of 5 last measurement points (based on ratio) = At
Divide At/A0
Use color gradient to see positive results immediately (an example is shown in Fig. 3)
Results & Discussion
Initial BRET luminescence scan Two controls were prepared. One well contained the biosensor without ligand – so a high BRET signal is expected (BRETMax Control). A second well consisted of the cAMP biosensor accompanied by a high ligand concentration. It was a ligand chosen that is known to lead to an increase in cAMP levels and therefore into a conformational change. For the latter a minimal BRET signal is expected (BRETMin Control). Overlayed luminescence spectra are shown in Fig. 2.
Fig. 2: CLARIOstar LVF monochromator luminescence scan from 320-600 nm with a resolution of 1 nm. The red line corresponds to the BRETMax Control, the blue line is the spectral result of the BRETMin Control. In the MARS Data Analysis software the moving average function was applied (factor of 5) to smooth the curve.
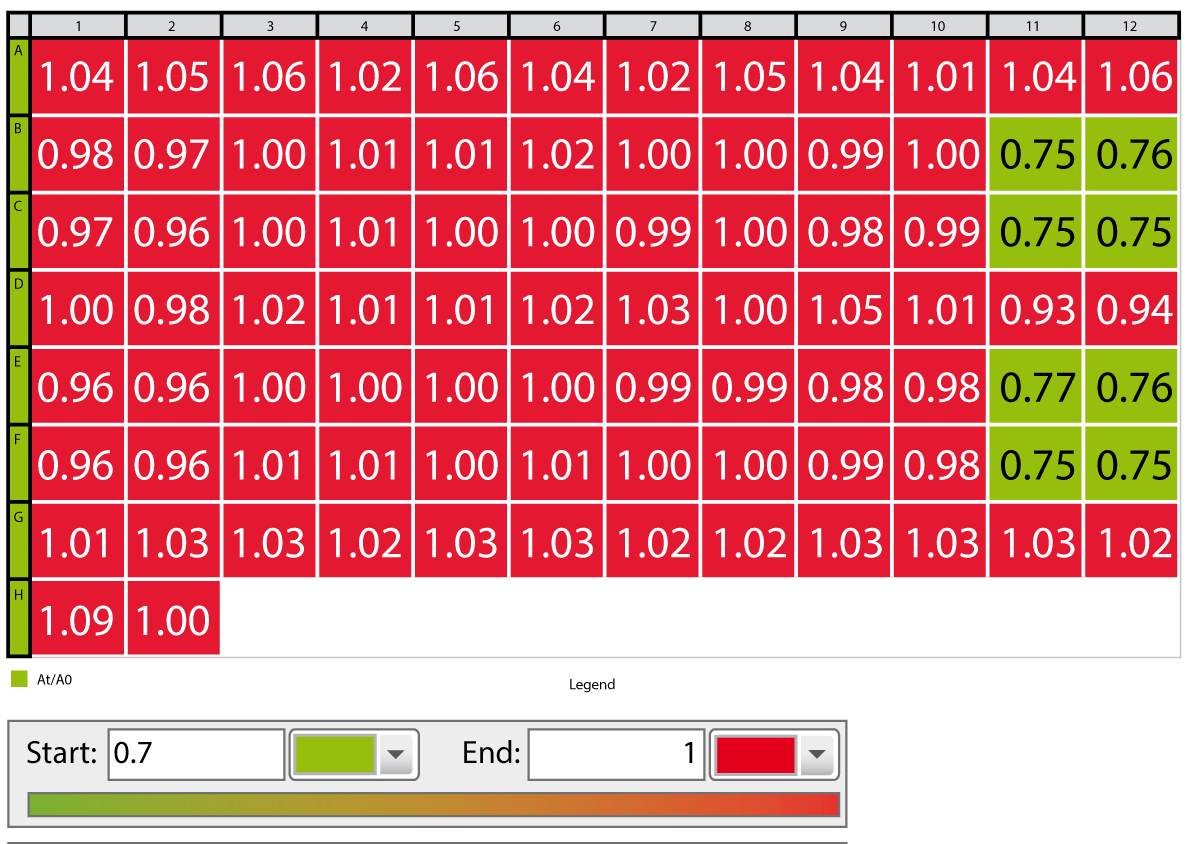
Binding of ligand to receptor Different ligands can be tested on one microplate. A color gradient was applied in the MARS Data Analysis software to get a fast overview of wells in which the ligand was effectively binding (Fig. 3).
Fig. 3: BRET1 ratio values obtained with the CLARIOstar. A color gradient was applied using green to indicate a successful ligand binding and red to show a negative result.
Only forskolin treated samples showed a decrease in BRET ratio. Forskolin is known to directly activate adenylate cyclase which in turn produces cAMP. Therefore, forskolin can be used as a control substance for this assay. A dose response curve was created by adding varying amounts of forskolin in replicate wells (Fig. 4)
Fig. 4: Forskolin dose response curve obtained with the CLARIOstar. The blue line is based on monochromator measurements while the red line is based on filter measurements.
Although the intrinsic assay window is quite small, the CLARIOstar is sensitive enough to detect small luminescence changes by either using BRET specific emission filters or by using the LVF monochromator. The standard deviation in replicates is small enough to obtain excellent 4-parameter dose response curves with R2> 0.999.
Conclusion
TheCLARIOstar microplate readeris a suitable instrument to detect protein ligand binding with the help of the cAMP BRET biosensor technology. The MARS Data Analysis software can be set up to use a color gradient to fast identify ligands that lead to a receptor conformational change.
References
Kocan and Pfleger (2011) Study of GPCR-protein interactions by BRET. Methods Mol. Biol. 746: 357-371.
Salahpour et al. (2012) BRET biosensors to study GPCR biology, pharmacology, and signal transduction. Front Endocrinol. (Lausanne) 3:article105.
Stoddart et al. (2015) Application of BRET to monitor ligand binding to GPCRs. Nat. Methods 12(7): 661-663.