ELISA (405, 420, 450, 492, and 650 nm)
Enzyme Linked Immunosorbent Assay (ELISA) is a commonly used biochemical assay that can detect the presence of an antibody or an antigen in a sample. A sample is incubated with a secondary antibody that recognizes an antigen (or a primary antibody) and that is bioconjugated to an enzyme. This enzyme reacts with a substrate (which can undergo further reactions) producing a solution whose change in absorbance can be measured (Fig. 1).
The two most commonly used bioconjugated enzymes are horse radish peroxidase (HRP) and alkaline phosphatase (AP). AP’s substrate, PNPP (p-Nitrophenyl phosphate), absorbs at 405 nm. HRP’s substrate is hydrogen peroxide which is coupled with the following chromogens that can be measured with absorption spectroscopy: ABTS (2,2’ Azino-di-(3-ethylbenzthiazoline sulfonic acid)) (405-420 nm), TMB (tetramethylbenzidine) (650 nm or 450 nm), and OPD (O-phenylenediamine dihydrochloride) (492 nm).
Instrument Settings
| SPECTROstar Nano | SPECTROstar/ FLUOstar Omega |
CLARIOstar |
PHERAstar FS | |
| Detection mode | Absorbance |
|||
| Method | Endpoint |
|||
| Optic settings |
Select either a full spectrum (220-1000 nm) or |
|||
The BMG LABTECH´s control software offers pre-defined assay protocols. Just one click is needed to start the measurement.
 Mimicking an ELISA assay, yellow dye is used at varying concentrations (Figure 2).
Linear regression fit of absorbance measurements at 450 and 430 nm (Figure 3) show that choosing the correct measurement wavelength can increase dynamic range significantly (>13 %)
NADH/NAD and NADPH/NADP Conversion (340 nm)
NADH/NAD+ and NADPH/NADP+ are cofactors used by many enzymes in numerous cellular function, including: energy metabolism, mitochondrial functions, calcium homeostasis, oxidative stress, gene expression, immunological functions, aging and cell death. The reduction of NAD+ to NADH and NADP+ to NADPH can be monitored at 340 nm because the oxidized forms do not absorb light at this wavelength (Fig. 4)
| SPECTROstar Nano | SPECTROstar/ FLUOstar Omega |
CLARIOstar |
PHERAstar FS | |
| Detection mode | Absorbance |
|||
| Method | Endpoint |
|||
| Optic settings | Select either a full spectrum (220-1000 nm) or Select part of a spectrum (220-400 nm) or Select NADH/NADPH specific wavelength at 340 nm |
|||
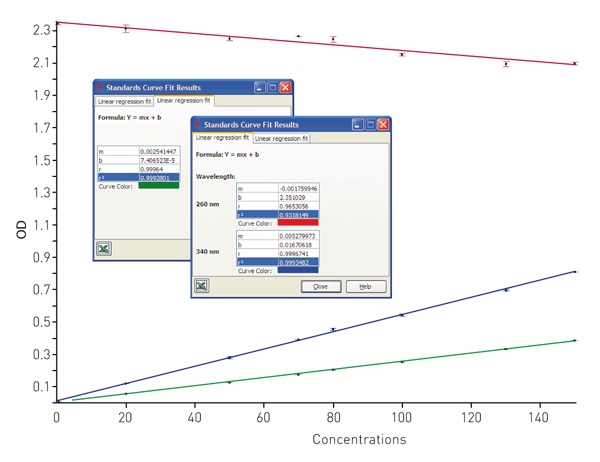
Using the MARS Data analysis software, linear regression fits of measurements taken at 260 and 340 nm can be done for NADP+/NADPH or NAD+/NADH conversion curve (Figure 5). A linear increase in signal at 340 nm is expected (example in Fig. 5 lead to a R2=0.99). However, unlike the fit of a usual dose response curve, the linear regression fit at 260 nm shows a slight decrease in signal as the NADPH concentration increased (Fig. 5, red line, R2=0.93). Theoretically, this peak should have no slope since the concentration of the dinucleotide is kept constant. However, there may be a slight decrease because it seems that NADP+ absorbs more light at 260 nm than NADPH. A linear regression fit of the ratioed measurements (340/260 nm) (green line) can be done to correct for this change. In Table 1 the sensitivity for NADH and NADPH is shown depending on the number of flashes.
|
|
NADH |
NADPH |
|
| Flashes | LOD µM (ng/mL) | LOD µM (ng/mL) | |
| 96 well | 20 | 20 0.748 (497) | 1.93 (1610) |
| 50 |
0.580 (386) |
1.58 (1322) |
|
| 100 | 0.465 (309) | 1.11 (931) | |
| 384 well |
20 | 3.761 (2501) | 1.80 (1497) |
| 50 | 3.418 (2773) | 1.38 (1151) | |
| 100 | 3.430 (2281) | 1.40 (1169) |
Conclusion
The microplate readers from BMG LABTECH all have a UV/Vis spectrometer that can measure any absorbance range from 220-1000 nm at 1, 2, 5, and 10 nm resolution in under 1 second per well. With this flexibility and speed, absorbance assays can be performed easily and fast.
In this application note, we have shown the power of the spectrometer in measuring ELISA assays or assays that need the cofactors NAD+, NADH, NADP+and NADPH.


