Introduction
Biomarkers are used in diverse scientific fields to evaluate normal and pathogenic processes or the response to therapy. Here we look at the biomarker interleukin 8 (IL-8) which is often associated with inflammation and has been shown to be increased by oxidative stress. Pharmacokinetic (PK) assays are used to measure the concentration of a drug that has been administered to a human or animal. PK assay data are used to evaluate elimination profiles of the drug and are important in drug safety and toxicology studies.
In this application note, we will show how the performance of the FLUOstar Omega microplate reader enables the detection of SPARCL (Spatial Proximity Analyte Reagent Capture Luminescence) assays. Examples of biomarker detection and pharmacokinetic assays are presented.
Assay Principle
SPARCL detection technology was used for rapid immunoassay development. This technology is a proximity-dependent and homogeneous method where an antibody/antigen interaction leads to the proximity of a chemiluminescent substrate (acridan, bound to antibody 1)) and an oxidative enzyme (horseradish peroxidase (HRP, bound to antibody 2)). The introduction of a trigger solution containing H2O2 generates a flash of light proportional to the amount of analyte present (Figure 1).
Materials & Methods
- SPARCL kits (Lumigen)
- FLUOstar Omega microplate reader (BMG LABTECH)
- 96-well, white, flat bottom microplates from Greiner
- Other reagents were obtained from commercial sources
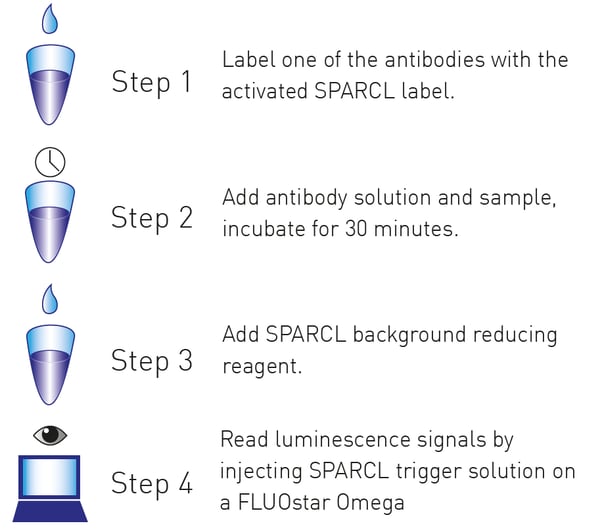
A typical Lumigen SPARCL assay workflow is shown below.
 For each experiment, one antibody was labeled with acridan according to SPARCL kit instructions while a second HRP-labeled antibody was purchased.
Biomarker Assay
A 1:2 dilution series of IL-8 was prepared from a starting concentration of 1000 pg/mL. Dilution of controls and the dilution series were made in cell culture media or PBS containing 0.1% BSA and 10% human plasma.
Pharmacokinetic Assay
A standard curve was generated using a dilution series of human IgG in neat (undiluted) rat serum. The highest point in the standard curve was 1000 ng/mL. Quality Control samples (QC) were made by spiking human IgG drugs into a neat rat matrix. QC concentration values were interpolated from the standard curve. The interpolated QC sample values were used to determine accuracy, precision, and total error.
For both experiments sample plating, antibody addition, incubation, and addition of background reducing agent were performed according to instructions.1 The plates were then read on the FLUOstar Omega plate reader with the following settings which include injection of the trigger solution.
FLUOstar Omega instrument settings
| Measurement type: | Luminescent (well mode) |
|
No. of intervals: |
50 |
|
Interval time: |
0.02 s |
|
Measurement interval time: |
0.02 s |
|
Emission filter: |
Lens |
|
Gain: |
3600 |
|
Injection volume: |
75 µl |
| Pump speed | 300 µl/s |
Results & Discussion
The FLUOstar Omega features reading at the time of injection which allows for the assessment of signal produced in the SPARCL reaction upon addition of the trigger solution (Figure 2).
Biomarker Assay
The data produced by the SPARCL IL-8 biomarker experiment was evaluated using results based on calculating the area under the curve. As seen in Figure 3 this method is suitable for assessing the SPARCL reaction providing a reliable fit curve.
Pharmacokinetic Assay
Similarly, SPARCL PK assays using IgG as a “drug” were performed. Figure 4 shows the representative curve produced from a dilution series of human IgG.
 Assay precision and reproducibility were assessed for the PK assay using replicates of QC samples tested in 2 different SPARCL assay test runs as shown below (Table 1).
| QC500 | QC125 | QC31.25 | |
| Number of measurements | 6 | 6 | 6 |
| Accuracy (%RE)* | -0.5 | -3.7 | -7.6 |
| Precision (%CV)** | 8.1 | 2.9 | 4.9 |
| Total Error (%RE +%CV) | 8.6 | 6.6 | 12.5 |
*%RE = Percent relative error; **CV = coefficient of variation
Conclusion
Lumigen’s SPARCL assay enables simplified immuno-assay development when paired with the reading at the time of injection capabilities of BMG LABTECH microplate readers such as the FLUOstar Omega. Both the IL-8 and the PK SPARCL assays show acceptable accuracy, precision, and total error. SPARCL may be formatted for many different assay types including high throughput screening applications.
References
- For more information about SPARCL contact Lumigen at SPARCL@beckman.com or visit www.lumigen.com/detection-technologies/sparcl
©2015 Lumigen, Inc. All rights reserved. Used with permission. Lumigen and SPARCL are trademarks of Lumigen, Inc. and are registered in the USPTO. Lumigen is a Beckman Coulter company.


