Introduction
Toxic substances in wastewater can destroy the biotic community inside a wastewater treatment plant. Wastewater testing is therefore important to ensure safe effluent discharges and appropriate wastewater treatments. The bacterium aliivibrio fischeri can be used for wastewater testing as its natural luminescence is reduced when in contact with toxicants. Here, we demonstrate that a commonly cuvette-based approach for wastewater testing can be performed on a luminescence microplate reader and that a kinetic approach gives more robust results especially when wastewater samples are coloured or turbid. Both methods for wastewater testing give essentially the same results when samples are not or only moderately coloured/turbid.
Assay principle
Wastewater toxicity can be determined by measuring the decrease in bioluminescence of aliivibrio fischeri as toxicants affect the bacterium’s metabolism and inhibit the luciferase-based formation of light that can be measured by a luminometer.
The luminescence signal I0 of the bacteria is measured at time 0 and after the bacteria have been incubated for a certain contact time t with the sample (It, fig. 1A). The relative change in luminescence ((I0-It ))⁄I0 induced by the toxicant is used to calculate the percent inhibition %H per sample.
Wastewater testing of coloured or turbid samples is more challenging especially when they absorb near 490 nm (maximum of luminescence signal). A classical approach to correct for these effects is to measure the absorbance of the samples (A) and down-size the values of I0 using a transmittance factor T=(1-e-ka)⁄(kA):

Herein k denotes an instrument constant. This colour correction (method A), however, is limited to samples with moderately low absorbance/turbidity.
Another approach is measuring a flash kinetic (method B, fig. 1B) with simultaneous injection + measurement.
Herein I0 denotes the maximum intensity of the kinetic luminescence signal in the range 0 – 30 s. Directly after injecting the bacteria into the sample, they have not experienced the toxic effect of the sample, yet. A reduced I0 is thus solely due to the colour effect. After the incubation the intensity It is reduced due to the sample’s toxicity and colour. The colour-effect automatically cancels upon calculating %H according to equation 1.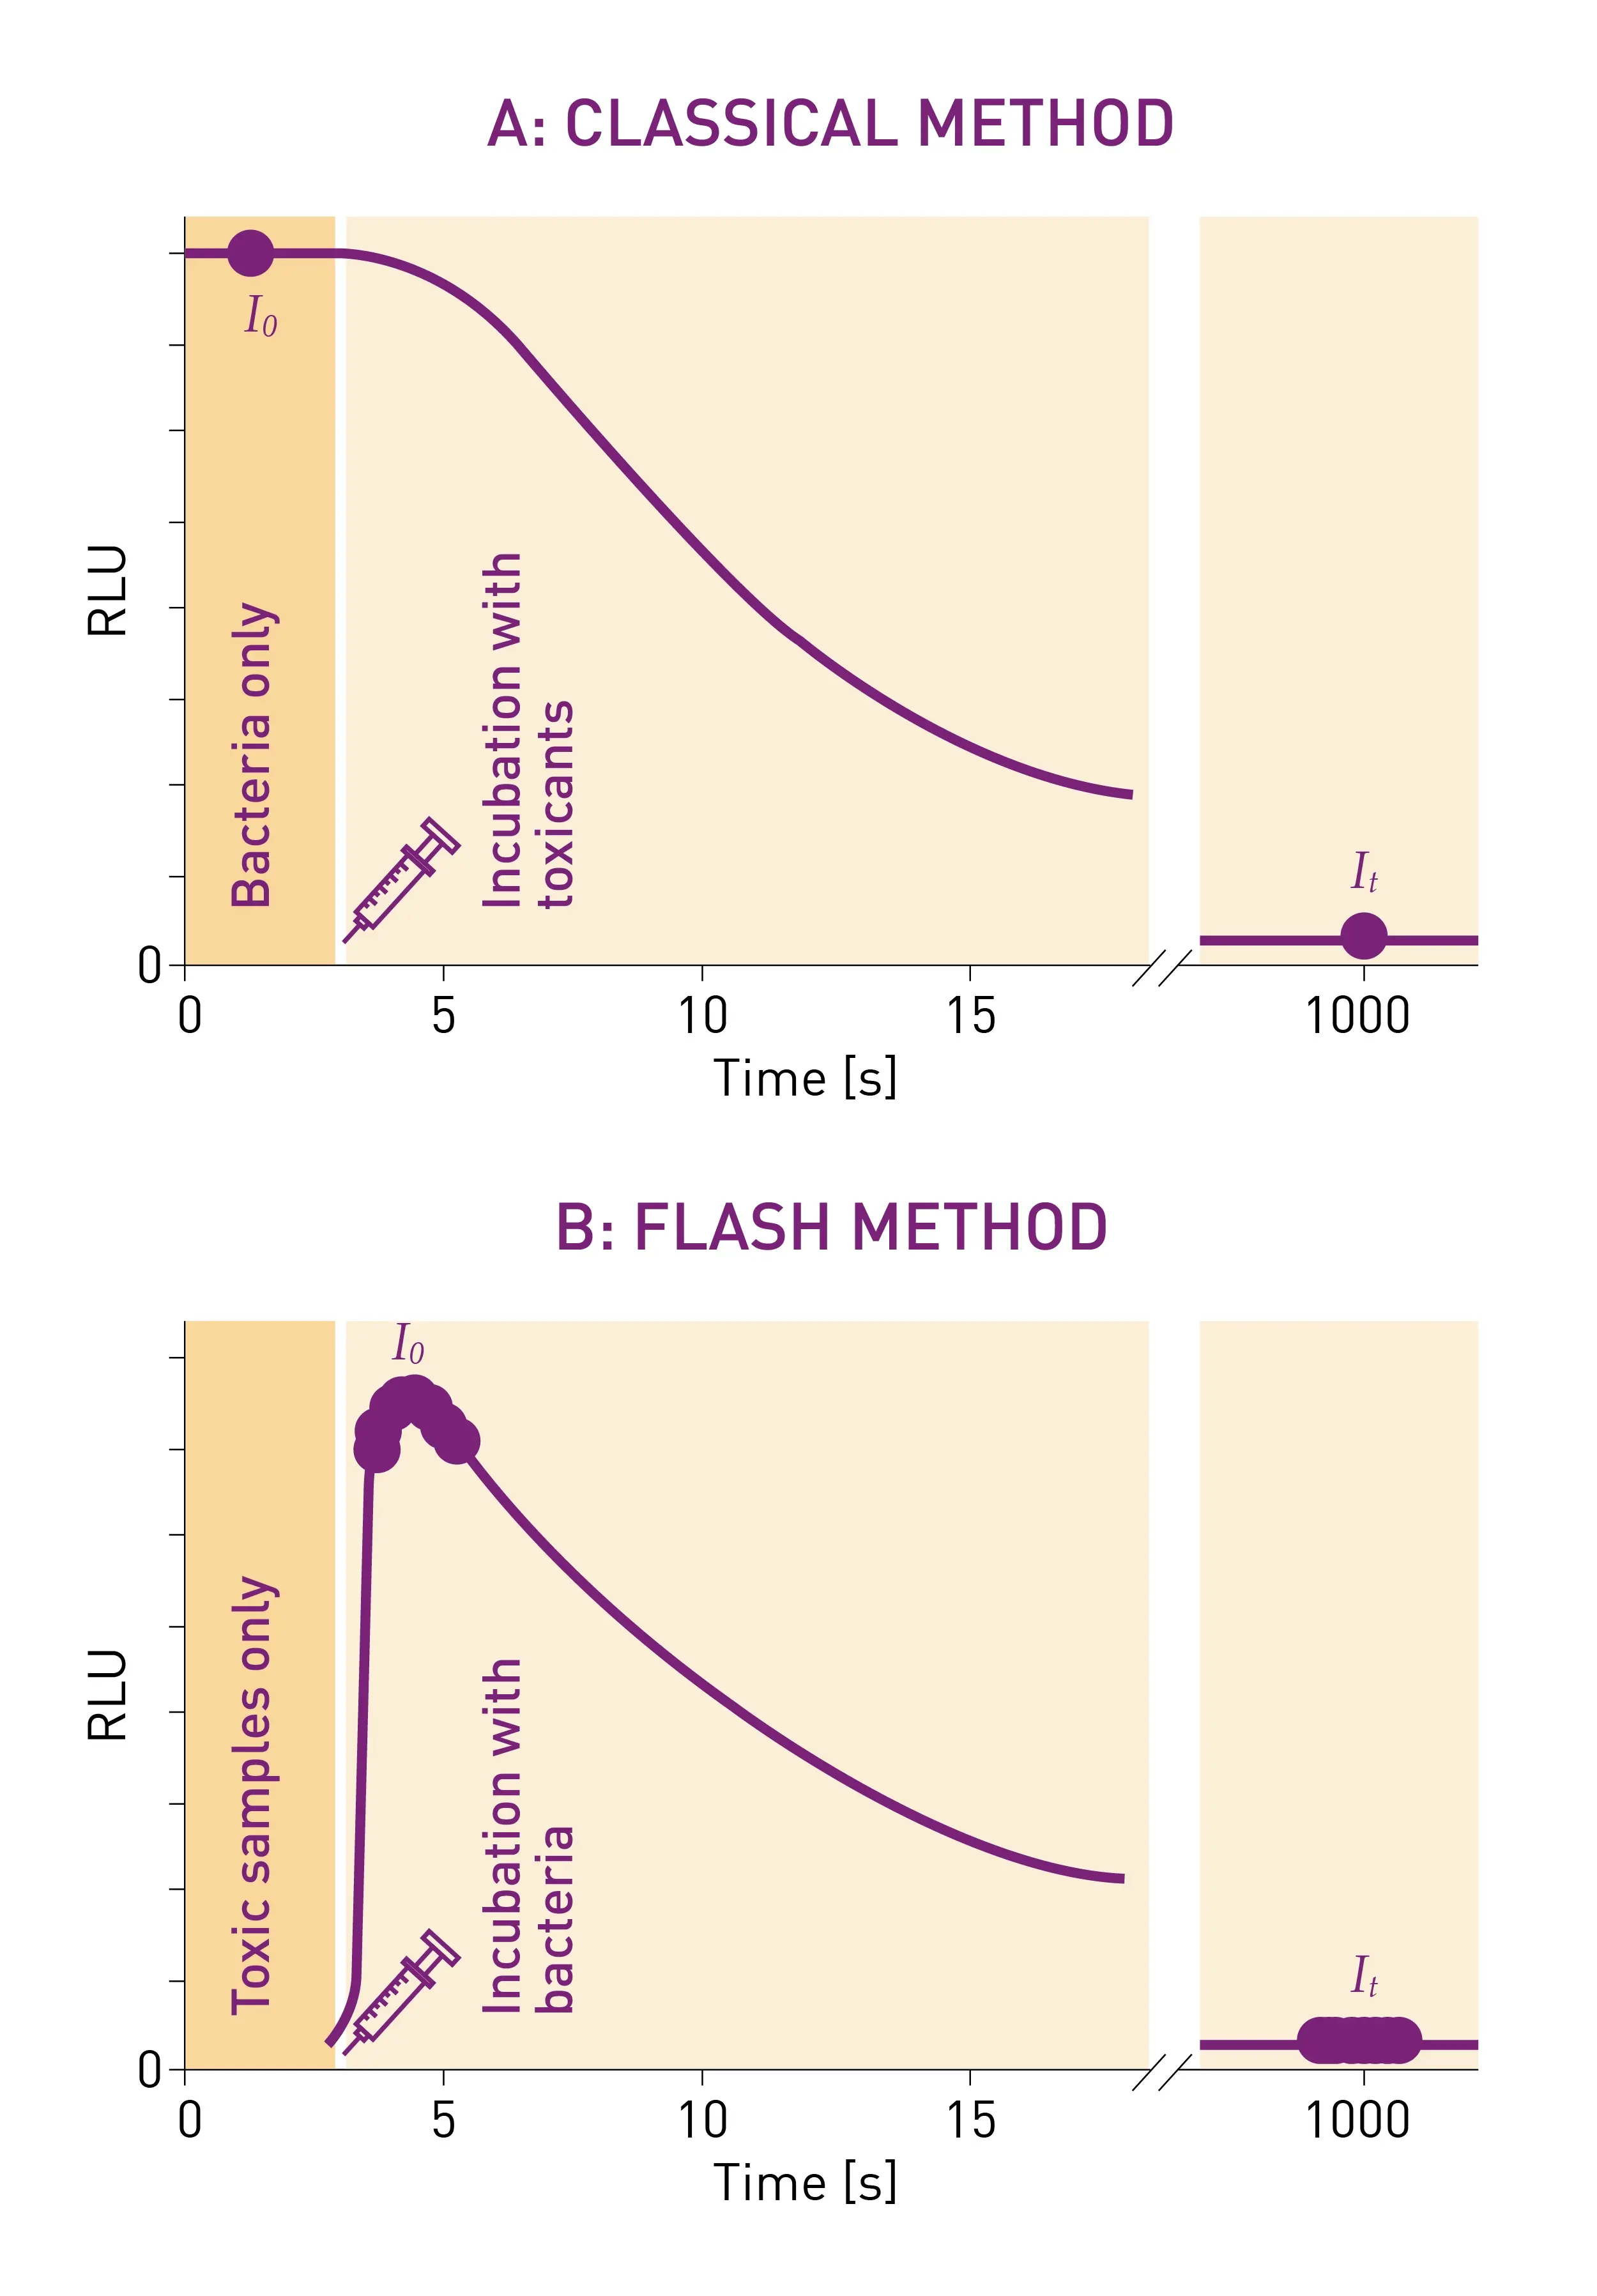 Wastewater testing is typically done based on a dilution series of the samples to determine the dilution, at which the mean inhibitory effect is below 20 %, which is a prerequisite to be non-toxic enough to be injected into a wastewater plant. The ED20 (effective dose 20) can be used for this purpose.
Materials & methods
- 96 half-area well plate white (#675075, Greiner)
- 96 well-plate white, clear bottom (#655095, Greiner)
- ZnSO4 · 7H2O (Caesar &Loretz GmbH)
- ZnSO4 · 7H2O (Caesar &Loretz GmbH)
- Ponceau 4R (#1XTX.1, Carl Roth) as colorant
- Hach™ LUMIStox Luminescent Bacteria Cuvette Tests (#LCK488, Thermo Fisher Scientific)
- FLUOstar Omega, BMG LABTECH
Experimental procedure
In a first set of wastewater testing experiments freeze-dried bacteria were reactivated in 800 µL reactivation solution, and multiple bacteria solutions were subsequently pooled and incubated for 30 min at ambient temperature.
To simulate different dilutions of a toxic wastewater, a dilution series of ZnSO4 solution was prepared. The final concentrations in the wells are shown in table 1. A second dilution series contained the same ZnSO4 concentrations but with Ponceau 4R (a non-toxic red dye, λOD max = 506 nm) added to simulate a coloured sample.
Measurement procedure
The aforementioned experiments were performed at RT using a FLUOstar Omega.
For method A, I0 was measured in the bacteria-only solution in the wells. It was measured after toxic samples (tab. 1) were added (1:2) and incubated for 30 min.
For method B, bacterial solution was injected well-wise, where wells already contained the samples. A luminescence kinetic was simultaneously measured for 30 s (I0). A second kinetic measurement followed after 30 min (It). Both methods were used to measure pure samples, and samples containing the food dye Ponceau 4R.
Table 1: Dilution levels and toxicant concentrations.
| ZnSO4 [mg/L] | 109.9 | 73.3 | 55.0 | 36.6 | 27.5 | 18.3 | 13.7 |
| ZnSO4 [mg/L] +P4R | 109.9 | 73.3 | 55.0 | 36.6 | 27.5 | 18.3 | 13.7 |
Instrument settings
|
FLUOstar Omega
|
||
|
Optic settings
|
Luminescence, endpoint
|
|
|
Luminescence Head, Top optic
|
||
|
Settling time
|
0.3 s |
|
|
Interval time
|
0.2 s |
|
| Gain | 3600 | |
| Filter | Lens | |
|
Kinetic Settings (Method B)
|
Well-mode | |
| Number of intervals | 150 | |
Results & Discussion
ED20 can be estimated by fitting a logistic dose-response curve model to the %H vs. dilution data which is straightforward in BMG LABTECH’s data analysis software MARS.
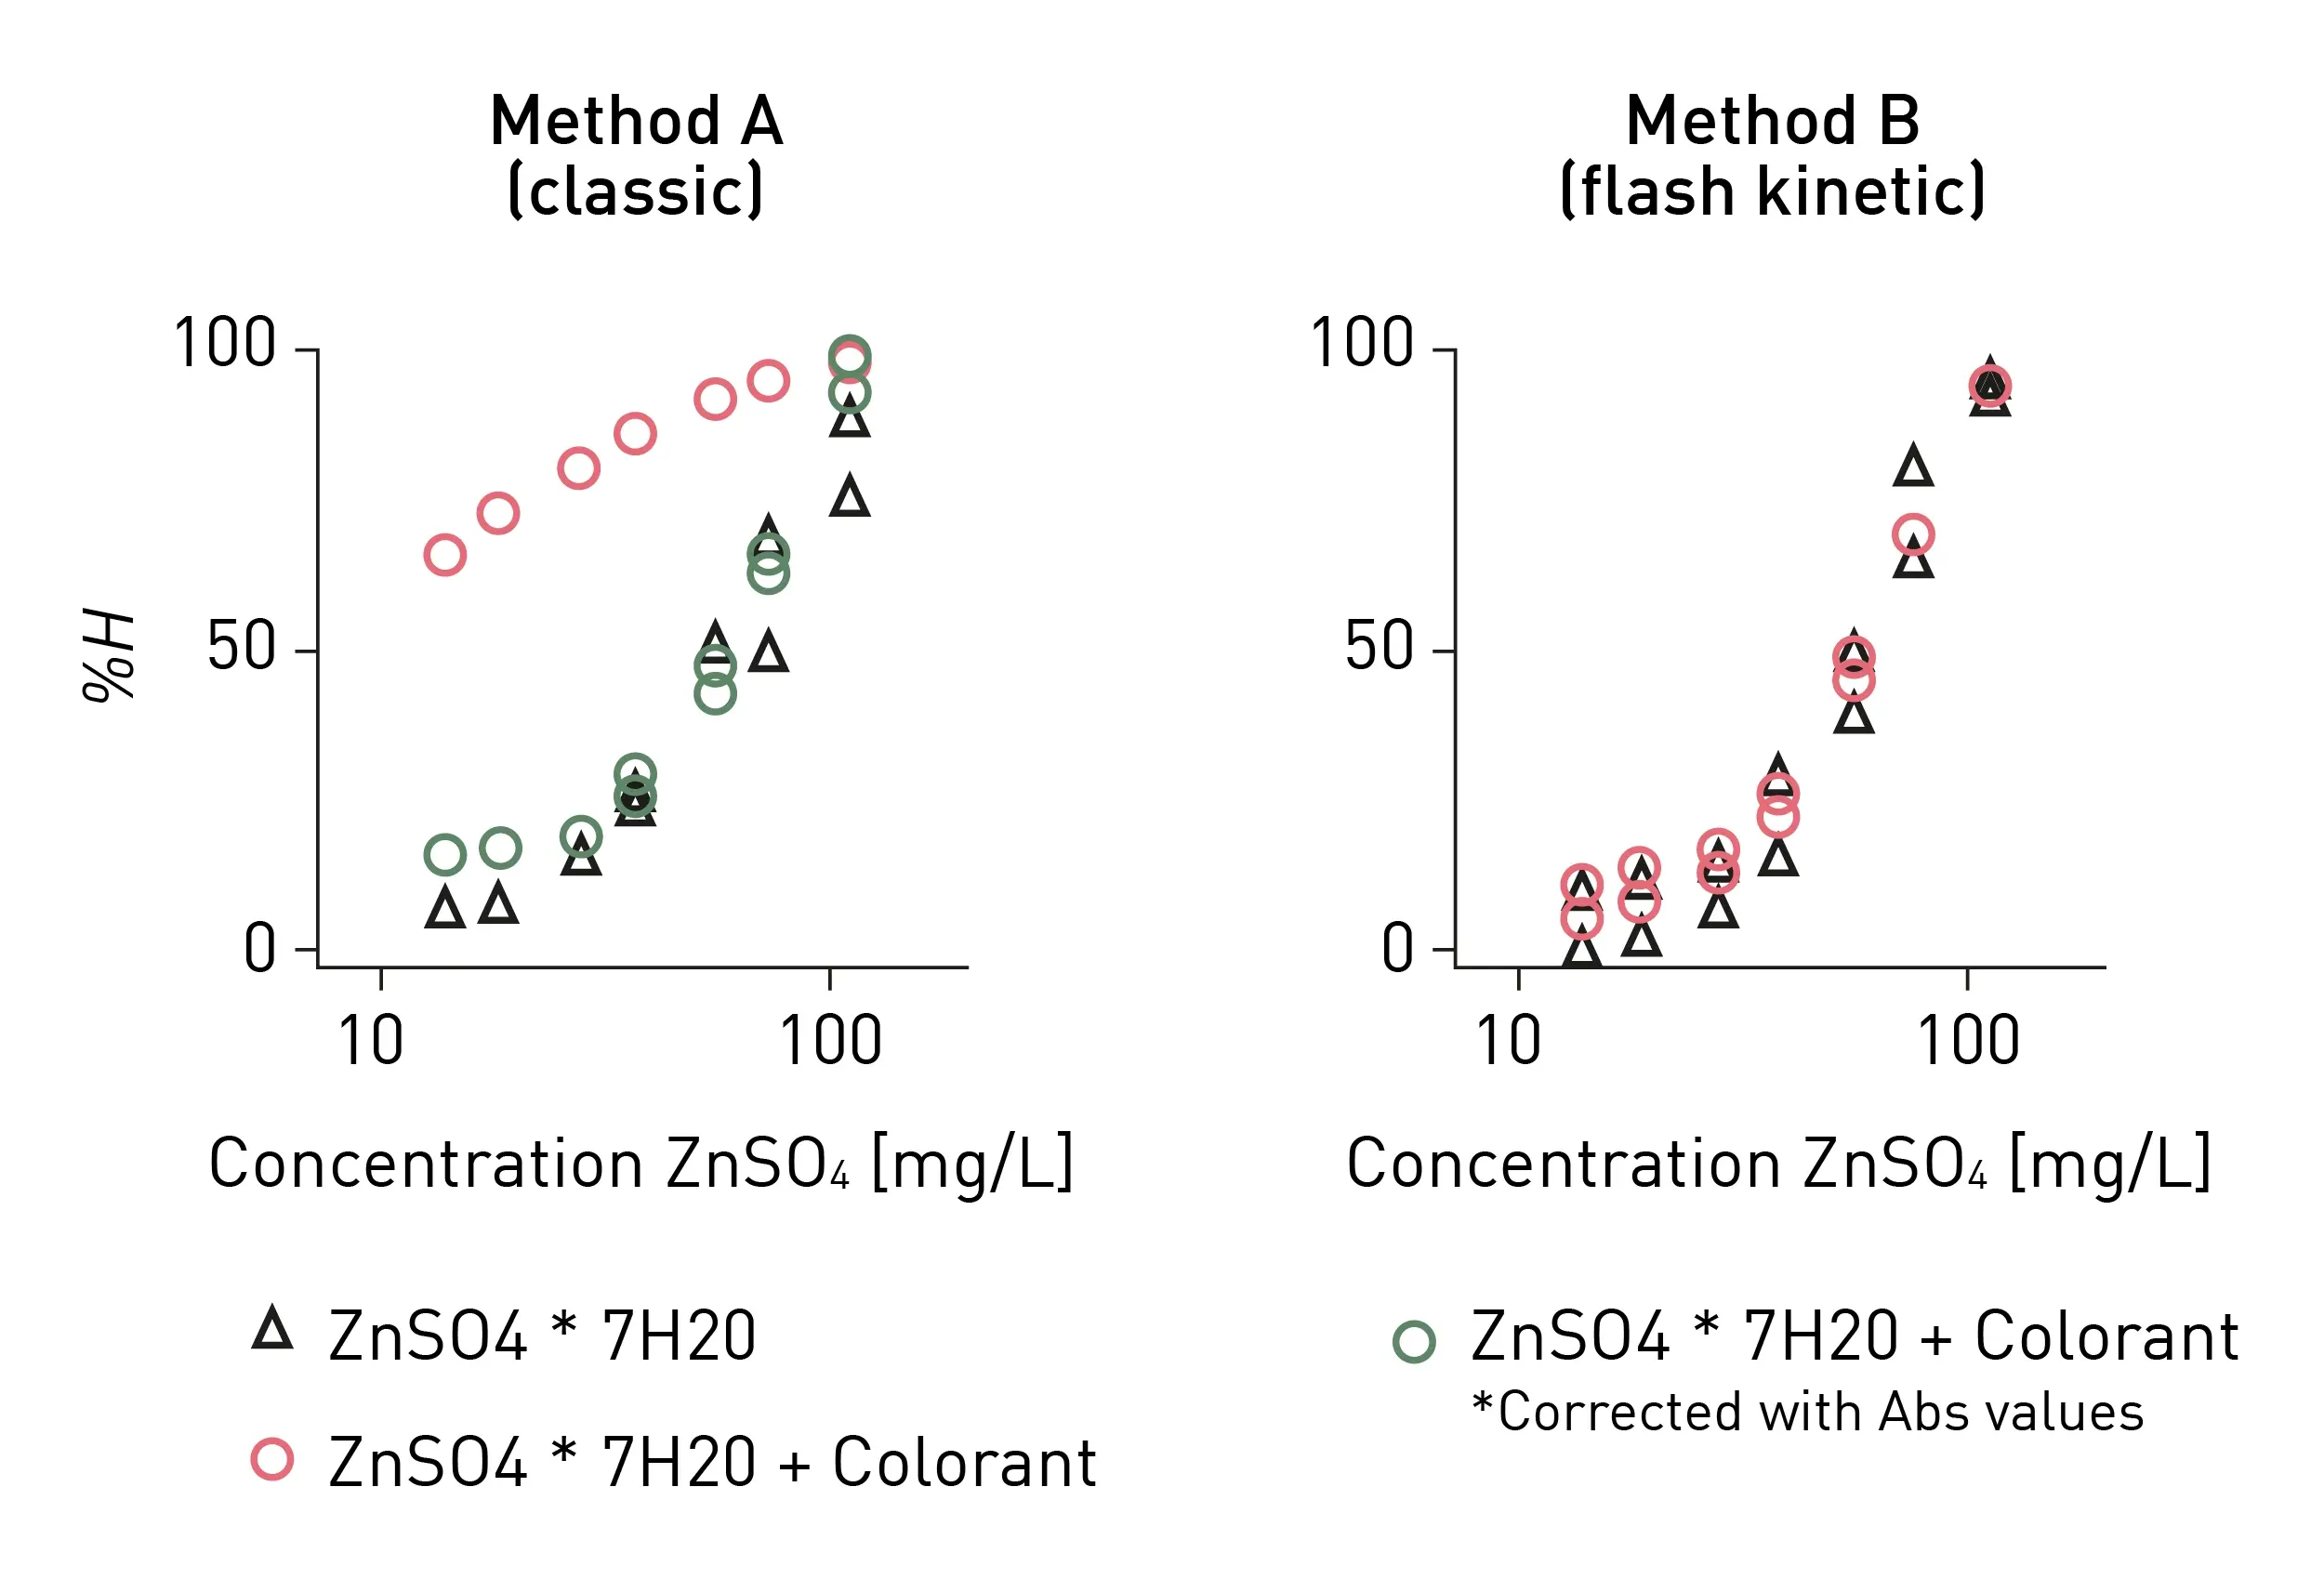
Figure 2 compares the dose-response curves of Ponceau 4R-coloured samples (red circles) and non-coloured samples (black triangles). The ODs of the coloured samples measured at 490 nm were used to correct the results of method A (green circles).
For method A, coloured samples lead to higher values for %H compared to non-coloured samples and seem more toxic. When absorbance is used to compensate for the colour effect the dose-response curves become essentially the same as those of the non-coloured sample.
The %H results obtained with method B remain the same regardless of the addition of colorant and thus eliminate the need for absorbance-based correction.
In the second set of experiments the ED20 values from a LUMIstar Omega (method B) and of a reference luminometer (method A) were compared. With 1.15 g/l (LUMIstar Omega) and 0.90 g/l (reference luminometer), both instruments give practically indistinguishable ED20 values.
Conclusion
Aliivibrio fischeri-based toxicity assays being often performed in dedicated cuvette luminometers can be measured on luminescence microplate readers, too. Performing these wastewater testing assays in a microplate, enables to miniaturize commercially available assays, thereby increase throughput and also save time and reagents.
The injectors available for all BMG LABTECH luminometers enable to automatically inject sample solution or bacterial solution to the wells and allow further automation of the assay and open the option to perform flash-luminescence kinetics. This approach allows to inherently correct for colour effects and is more robust than the classical colour correction approach.