If absorbance is measured in microplates, photons are transmitted through a liquid sample before detection. Some analytes, like nucleic acids or amino acids, show a natural extinction of light at a specific wavelength. If the specific extinction factor of an analyte is known, its concentration in a sample solution can be calculated without any need to stain or include a standard series with known concentrations. However, there is one constraint: direct absorbance-based calculation methods depend on the path length of the analysed solution (formula 1).
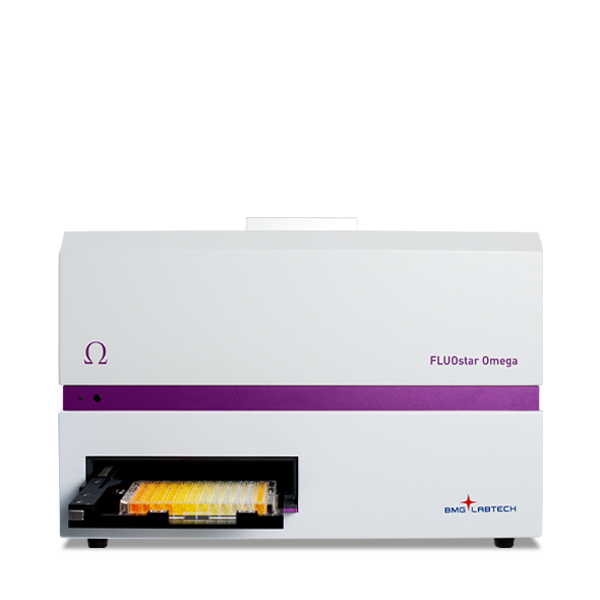
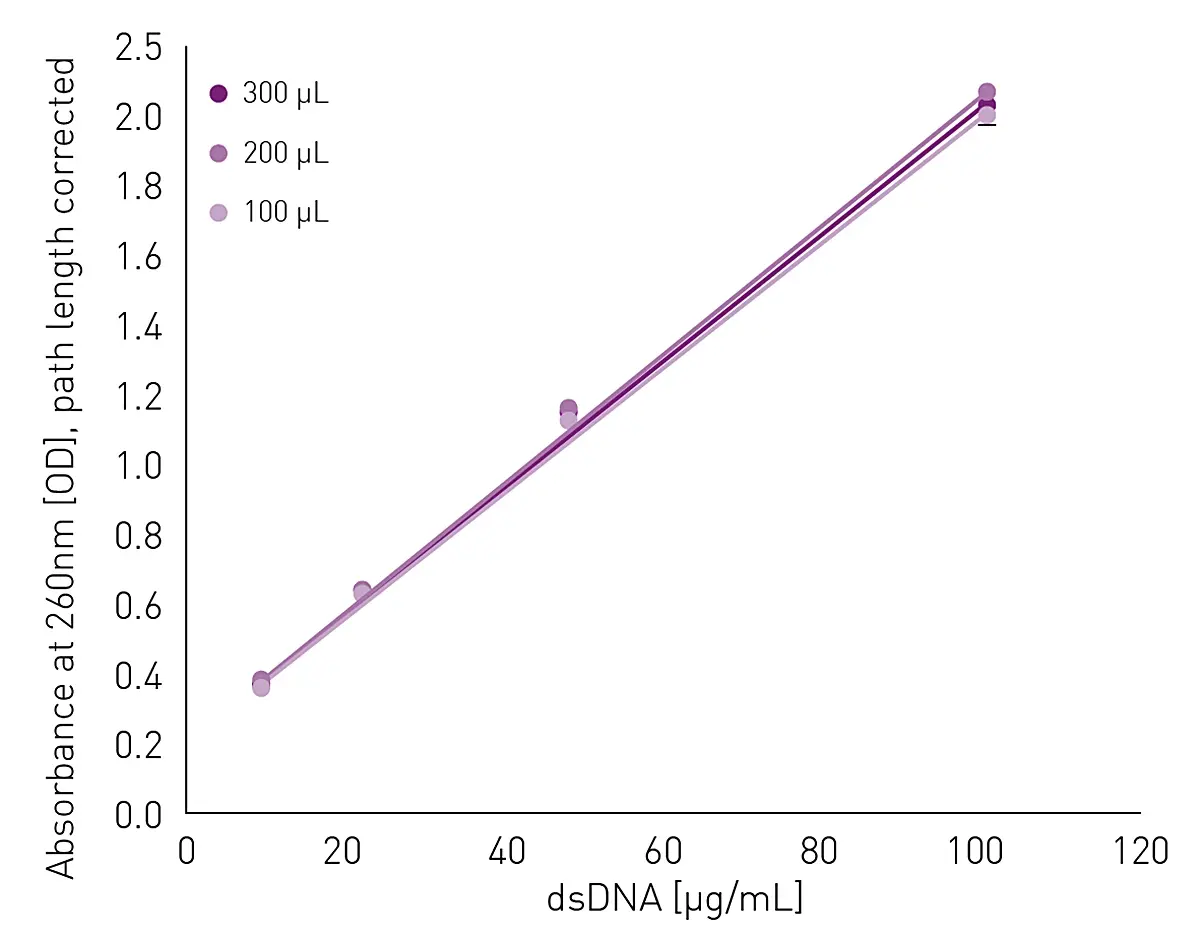
DNA standards ranging from 10 to 100 µg/mL were pipetted into different wells of a 96-well microplate. Each standard was added in triplicate with final volumes of 100 µL, 200 µL and 300 µL, respectively. Obtained OD values increase with the fill volume in the microplate well as the path length of the liquid increases. Each data point shows the mean value of three replicates including standard deviation.
Did you know?
With BMG LABTECH‘s LVis Plate, you have the option to work with a cuvette in all absorbance-based microplate readers. The horizontal cuvette position allows measurement of standard rectangular cuvettes without the need for a designated cuvette port.
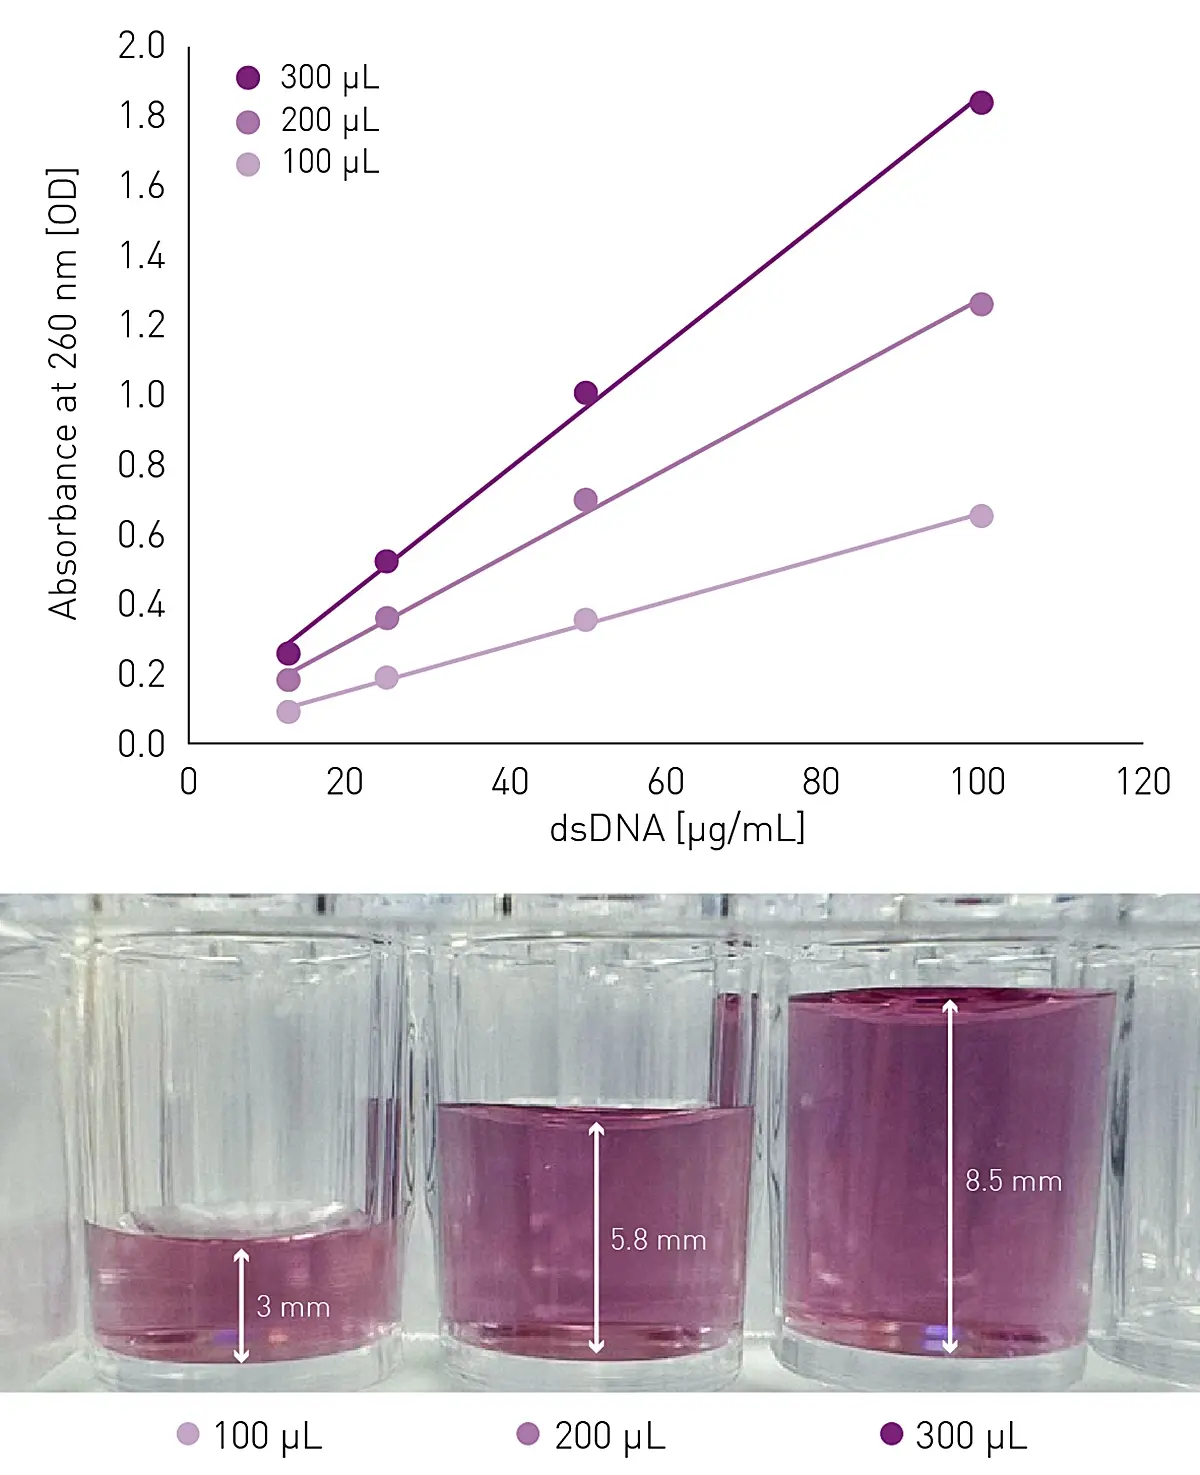
The sample path length also depends significantly on meniscus effects in the microplate wells (fig. 2). A meniscus is a manifestation of capillary action, by which either surface adhesion pulls a liquid up to form a concave meniscus, or internal cohesion pulls the liquid down to form a convex meniscus. In microplates, we are usually dealing with concave menisci (see figure 2B). Here, surface tension, polarity and other factors lead to shorter path lengths in the centre of the well, while longer path lengths are observed at the edge of the well.
 Macroscopic side view of liquid level in the well and path length of liquid schematically displayed for different positions across the microwell area. A) Microwells without meniscus display a planar liquid level and lead to a uniform well readout B) Meniscus formation decreases path length in the centre of the well and increases it at the edge. This can result in variations in readout when a measurement is performed at multiple positions of the microwell or in direct comparison of wells with and without menisci.
Did you know?
The influence of meniscus is not limited to absorbance measurements. A curved surface also influences, for example, the reflection of the emission in fluorescence measurements when the top optics are used.
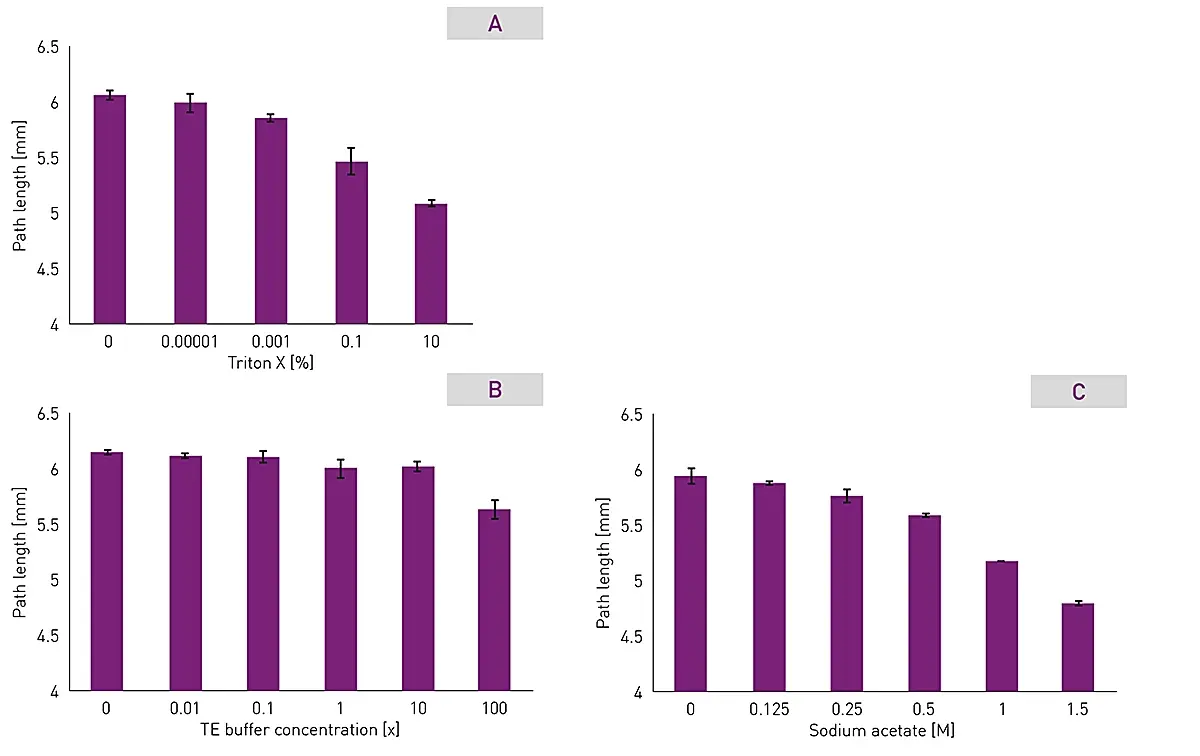
The properties of the measurement sample are one factor leading to meniscus formation. For example, different compositions of buffer like those including TRIS or acetate (figure 3 B+C) can lead to meniscus formation. This results from to the increased physical interaction of the solution with the surrounding microplate material. When working with detergents like Triton X (figure 3A) the reduction of the surface tension of the liquid is mainly responsible for the increased meniscus effect.
Another important factor is the type and geometry of the microplate used. Available plate geometries range from square to round wells and from flat (used for applications such as adherent cell cultures) over V-shaped (for maximum sample retrieval) to U-shaped wells (which facilitate mixing and washing and are often used for suspension cells and spheroid or organoid cultures). Round wells generally lead to a more uniform meniscus formation compared to square wells. Similarly, plates that are free of imperfections are less likely to exhibit meniscus effects. They may also decrease trapped air at the bottom of the well, enabling a more consistent meniscus level from well-to-well. Round wells are therefore the preferred choice in order to minimize meniscus effects in absorbance measurements. U- or V-shaped wells create different path lengths in the inner and outer areas of the well, even without meniscus formation on the surface and therefore involve additional hurdles. Flat bottom well plates are therefore the preferred choice to provide homogenous path lengths in all areas of the well. Since menisci and the related change in path length can have a substantial influence on calculated concentrations, meniscus effects should be avoided or compensated for as far as possible.
Did you know?
In addition to round and square wells and V- and F-bottoms, there are also some intermediate shapes. You can get an overview in our article on ‘The microplate: utility in
practice’.
How to identify meniscus effects
The easiest way to identify a meniscus effect for a sample in a microplate is to check macroscopically for a lens effect. Place a piece of paper with written text underneath the filled microplate (figure 4, left panels). Look through the wells. If the letters appear smaller than the original text, a meniscus was formed within the wells (like looking through a concave shaped lens). Alternatively, a look at the side of the wells, as shown in Fig. 2B, also provides evidence about the presence of a meniscus effect.
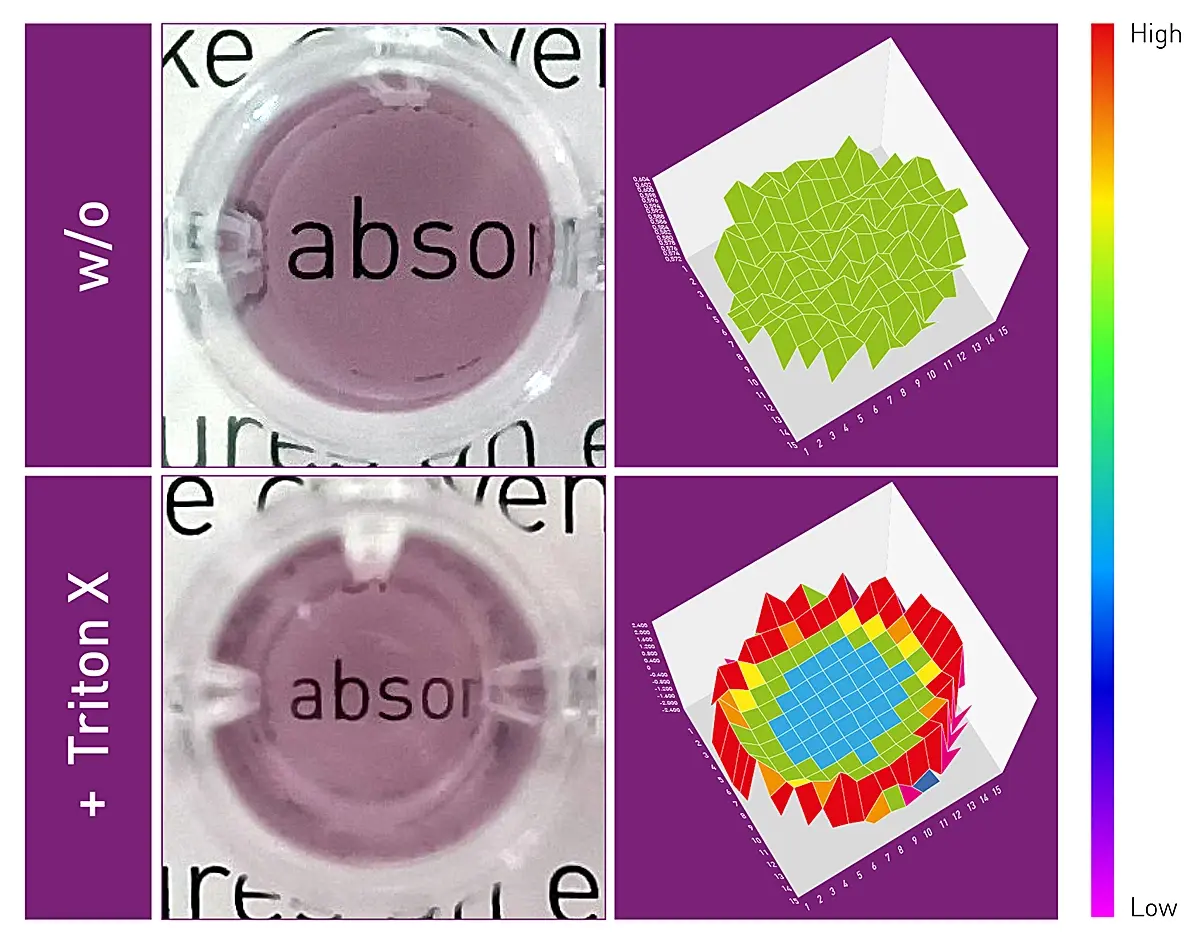
Concave menisci result in a plano concave lens effect. Left panels: by placing a text below the transparent microplate, it can be seen how this type of meniscus reduces the size of the text. Right panels: the path length of liquid displayed for different positions across the microwell area visualises the meniscus effect.
How to deal with meniscus effects in microplates
Activate path length correction
If available, the easiest option is to activate “path length correction” during protocol setup. When selecting this option, the microplate reader and the software will exploit a natural characteristic of aqueous solutions called the water peak. Pure water absorbs light between 930 and 1100 nm (figure 5). As most analytes do not absorb light in the upper range of the spectrum, this behaviour can be used to normalize the measured data internally to a 1-cm path length.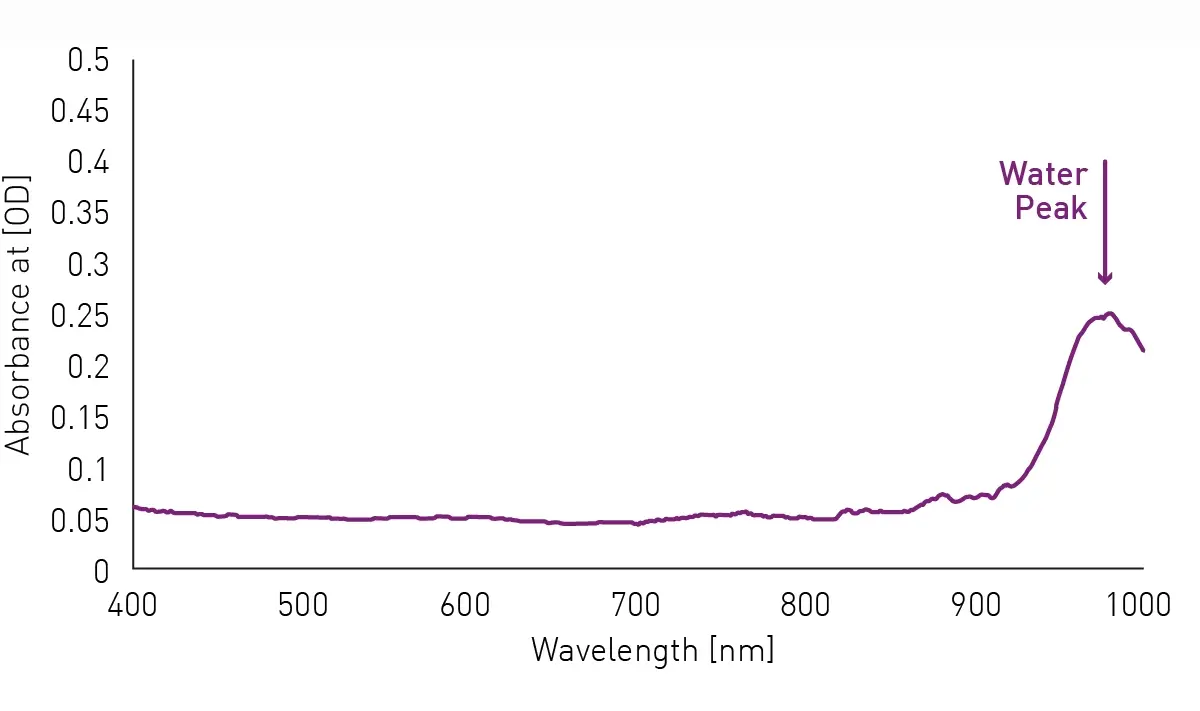 Water shows a natural absorbance peak at about 970 nm. Since this peak is found at a wavelength where most analytes do not show any absorbance, it can be used to determine the path length of a sample and normalize the obtained absorbance values to the fill volume regardless of meniscus.
Path length correction can be used to correct for different fill volumes in wells of a microplate. If the same standard curve shown in figure 1 is measured with path length correction on, the wells with different fill volumes of the DNA standards of the same concentration finally show comparable absorbance values (figure 6).
 Path length correction compensates for the different fill volumes and generates comparable absorbance values and calculated concentrations regardless of the fill volume. Each data point shows the mean value of three replicates including standard deviation.
However, this option cannot be applied independently to every scenario. As the method is based on the absorbance properties of water, it only works in aqueous solutions. A dilution series based on ethanol for example will not provide comparable and reliable results. This method of path length correction is also problematic when measuring OD600. The OD600 method is not based exclusively on the absorbance but primarily on the scattering of light by a sample. As this is not limited to 600 nm but extends across all wavelengths and can also be found at around 1000 nm, the wavelength used for water peak correction is also affected. This results in a dependency of the determined path length on the OD of the sample.
Did you know?
As an alternative, to optical path length determination, a volume-based option is available in BMG LABTECH’s microplate reader control software. If plate dimensions and the used volume are available, the path length is calculated and applied by the software. This option is not affected by light scattering.
Use microplates with an adequate surface treatment
In addition to the physical properties of the liquid analyte, the properties of the microplate and, above all, the treatment of the material surface play a key role. A meniscus is more likely to build up on a hydrophilic than on a hydrophobic surface. Most microplates made for absorbance measurements are made of polystyrene (PS). Untreated PS is hydrophobic while treatments like the introduction of hydroxylic and carboxylic groups in tissue culture (TC)-treated plates generate highly hydrophilic surfaces. In highly hydrophilic microplates, meniscus formation already occurs with pure water independently of the presence of a detergent like Triton X (figure 7). So better check whether your experiments really require a surface treatment or whether untreated plates are equally suited to avoid possible meniscus effects.
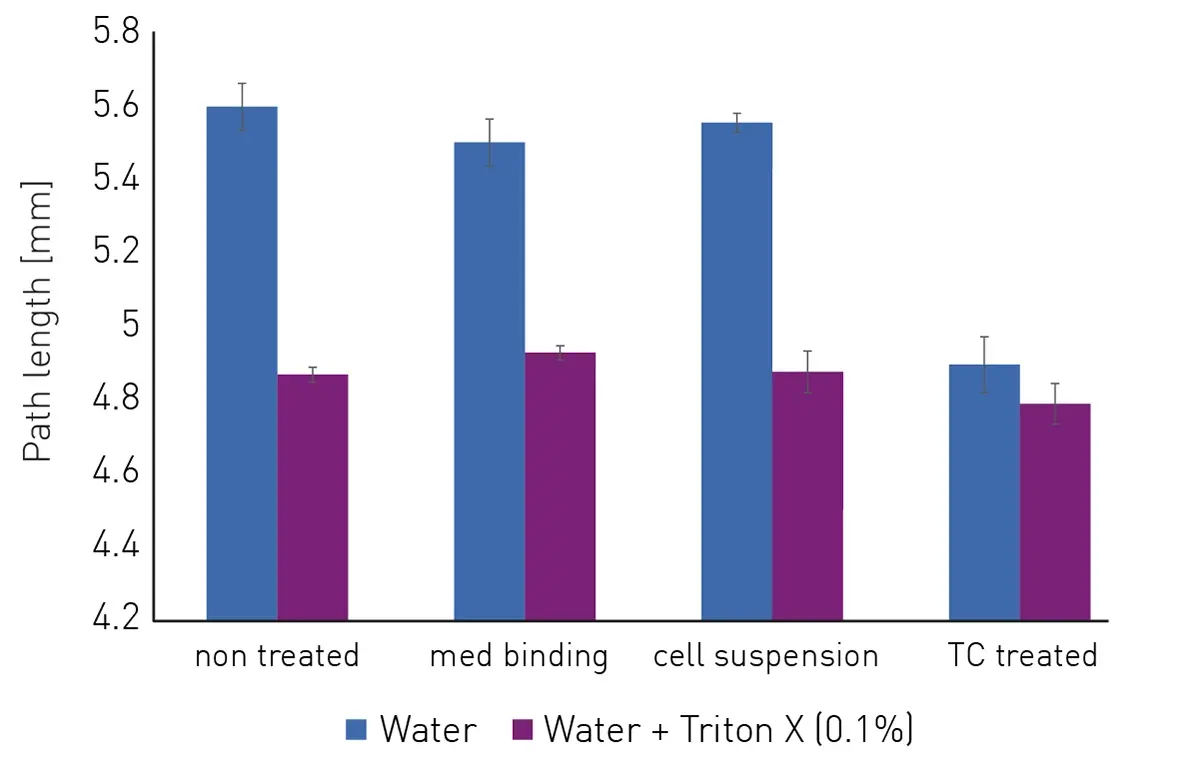 Water with and without 0.1% Triton X was measured in 96-well plates with different surface treatments. Non-treated, medium-binding, cell suspension and tissue-culture (TC) treated plates have different effects on meniscus formation. While Triton X leads to a strong meniscus formation in all plates, water forms menisci only in plates showing a hydrophilic surface like TC-treated plates.
Plates may look the same macroscopically but bear different consequences. For example, TC-treated plates are the best choice in cell culture but may not be suitable or necessary for every application. When used for enzyme-linked immunosorbent assays (ELISAs) or protein determination, they can compromise results.
Fill your wells to the brim
A meniscus effect can only occur because the edges of the liquid level are pulled up by a capillary effect on the walls of the microwell. If the liquid level ends at the same height as the edge of the well, there is no more room for this effect (figure 8). Triton X was added to both wells in the lower panel. However, only the well with a fill volume of 200 µL shows a meniscus effect. The wells that were filled to the brim show a planar surface, independent of the presence of Triton X. This is of course only an option for measurements based on samples for which sufficient material is available and which are not too valuable. A microplate with completely filled wells should not be shaken inside the reader.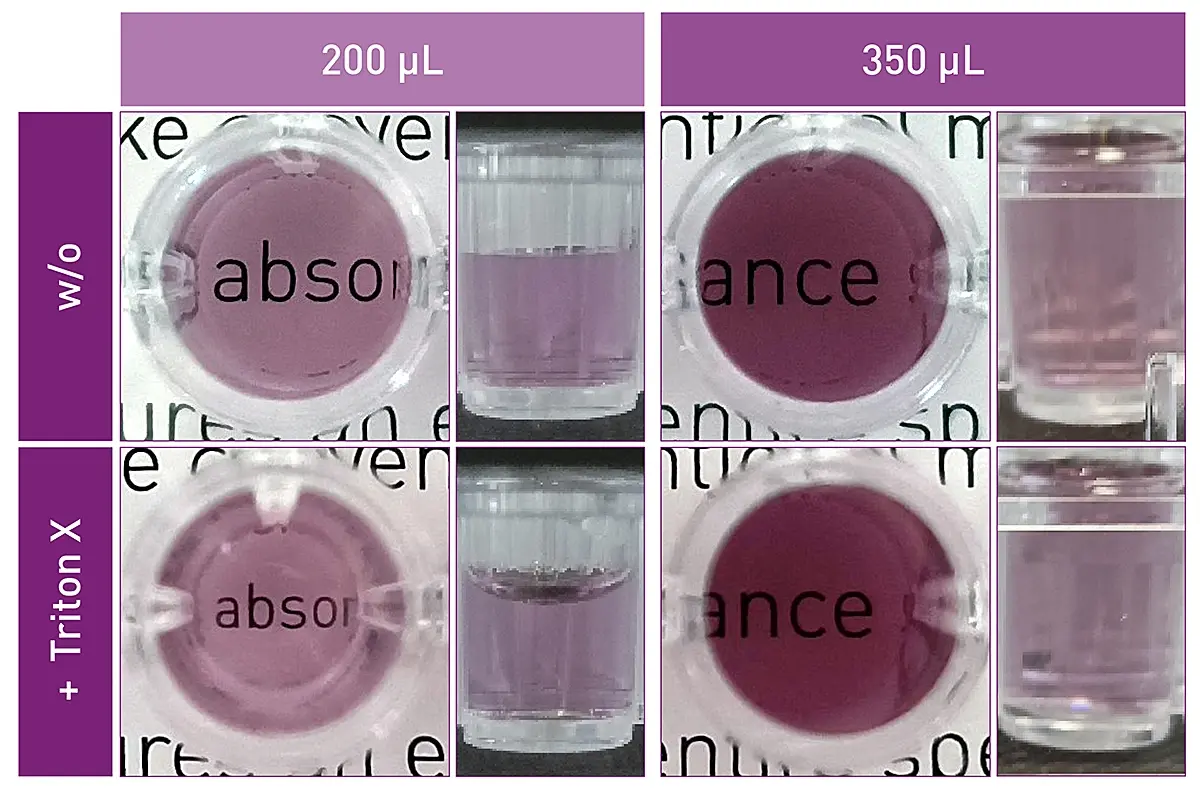
Conclusion
- Meniscus formation affects path length in microplate wells and may specifically distort absorbance measurements and subsequent calculation of concentrations.
- Meniscus formation in aqueous solutions can be reduced by
- The use of microplates with hydrophobic surface
- Decreasing, eliminating or correcting for agents like TRIS, acetate and detergents
- Filling microplate wells up to the brim.
- The influence of meniscus formation on absorbance measurements and downstream calculations can be compensated for in many cases with the path length correction
- Initial recommendation
- Detailed Recommendation