The Optical Density at 600 nm (OD600) is a widely used metric in microbiology and biotechnology for quantifying the growth of microbes. This method allows researchers to monitor the growth of bacteria, yeasts, and other microorganisms in real-time.
OD600 measurements are crucial in various applications, including fermentation processes, antibiotic susceptibility testing, and the production of recombinant proteins. By providing insights into the physiological state of cultures, OD600 measurements help optimize growth conditions and improve yields in industrial applications. The great popularity of the OD600 method can also be explained by the fact that it is a non-destructive approach. It can be performed as often as needed during the growth of a culture without killing or harming the microbes.
OD600 measurements rely on an analytical device using absorbance mode, even though bacteria do not absorb visible light. Instead, the device detects light scattering, where microbial particles disrupt the light path and reduce the amount reaching the detector, mimicking absorbance. In other words, the absorbance mode is only used to determine the extent of light scattering instead of measuring the physical absorbance of light energy by microbes. This is an important point with practical consequences: OD600 measures light scattering via loss of transmission and not absorbance. The more particles found in a solution, the more the light is scattered. Accordingly, a replicating population of bacteria or yeasts increases light scattering and measured absorbance values over time.
Did you know?
The linear relationship of microbial cell counts and measured OD600 values is lost at high cell densities as these can lead to multiple scattering events among the particles. A linear relationship typically occurs up to 1 OD.
OD600 measurements, which were first performed at the beginning of the 20th century, were typically and often still are carried out in cuvettes. Cuvettes represent a standardised and well-established model which has a low susceptibility to errors during measurement and evaluation. However, measuring in cuvettes often means a lot of manual effort, a high required sample volume and an overall time-consuming process, which means the parallel measurement of different samples is only possible to a limited extent. Microplate readers on the other hand can be used to continuously monitor microbial growth without manual intervention. With shaking options, temperature and gas control, many microplate readers function essentially as an incubator with measurement option. In a 96-well plate, a microplate reader requires less than 200 µL of microbe suspension to automatically measure the growth process at a selected interval. In contrast to cuvette readers, microplate readers are perfectly suited to measure multiple samples in replicates and to compare different media conditions or strains. For mid- to high-throughput applications, processes can be automated. This way, microplate readers not only save time and reagents but also substantially increase the reliability of results, as they allow many experiments to be performed in parallel using the exact same conditions.
A few points should be kept in mind to obtain high-quality OD600 data from microplate-based experiments. In this HowTo Note, we provide an overview of common pitfalls and possible tweaks to optimise your OD600 results.
Did you know?
BMG LABTECH microplate readers are available with a shaking frequency from 100-700 rpm. Optional extended shaking allows up to 1100 rpm.
Choose an adequate shaking frequency and shaking pattern
The growth and rate of cell division of microbes depends on various factors, like temperature and pH, but also largely on available nutrients and gases. During culture in the laboratory, the supply of nutrients and gases is facilitated by constant movement of the cell suspension in a shaker. Shaking prevents the microbes from sinking and settling to the bottom of the vessel. At the same time the shaking frequency affects the distribution of nutrients and gases within the cell suspension, influencing growth rates. The ideal shaking settings depend on the well volume, plate geometry, and the growth requirements of the microbes, making it essential to optimize these parameters for each experiment. Most microplate readers allow the shaking frequency and the shaking pattern to be varied. Figure 1A shows the growth curves of an E. coli strain, cultured in a 96-well plate over 12 h at different shaking frequencies from 100 rpm to 1100 rpm. While increasing shaking frequencies between 100 rpm and 900 rpm led to faster increasing growth curves, very high frequencies such as 1100 rpm seem to have no additional infl uence on the growth rate of E. coli.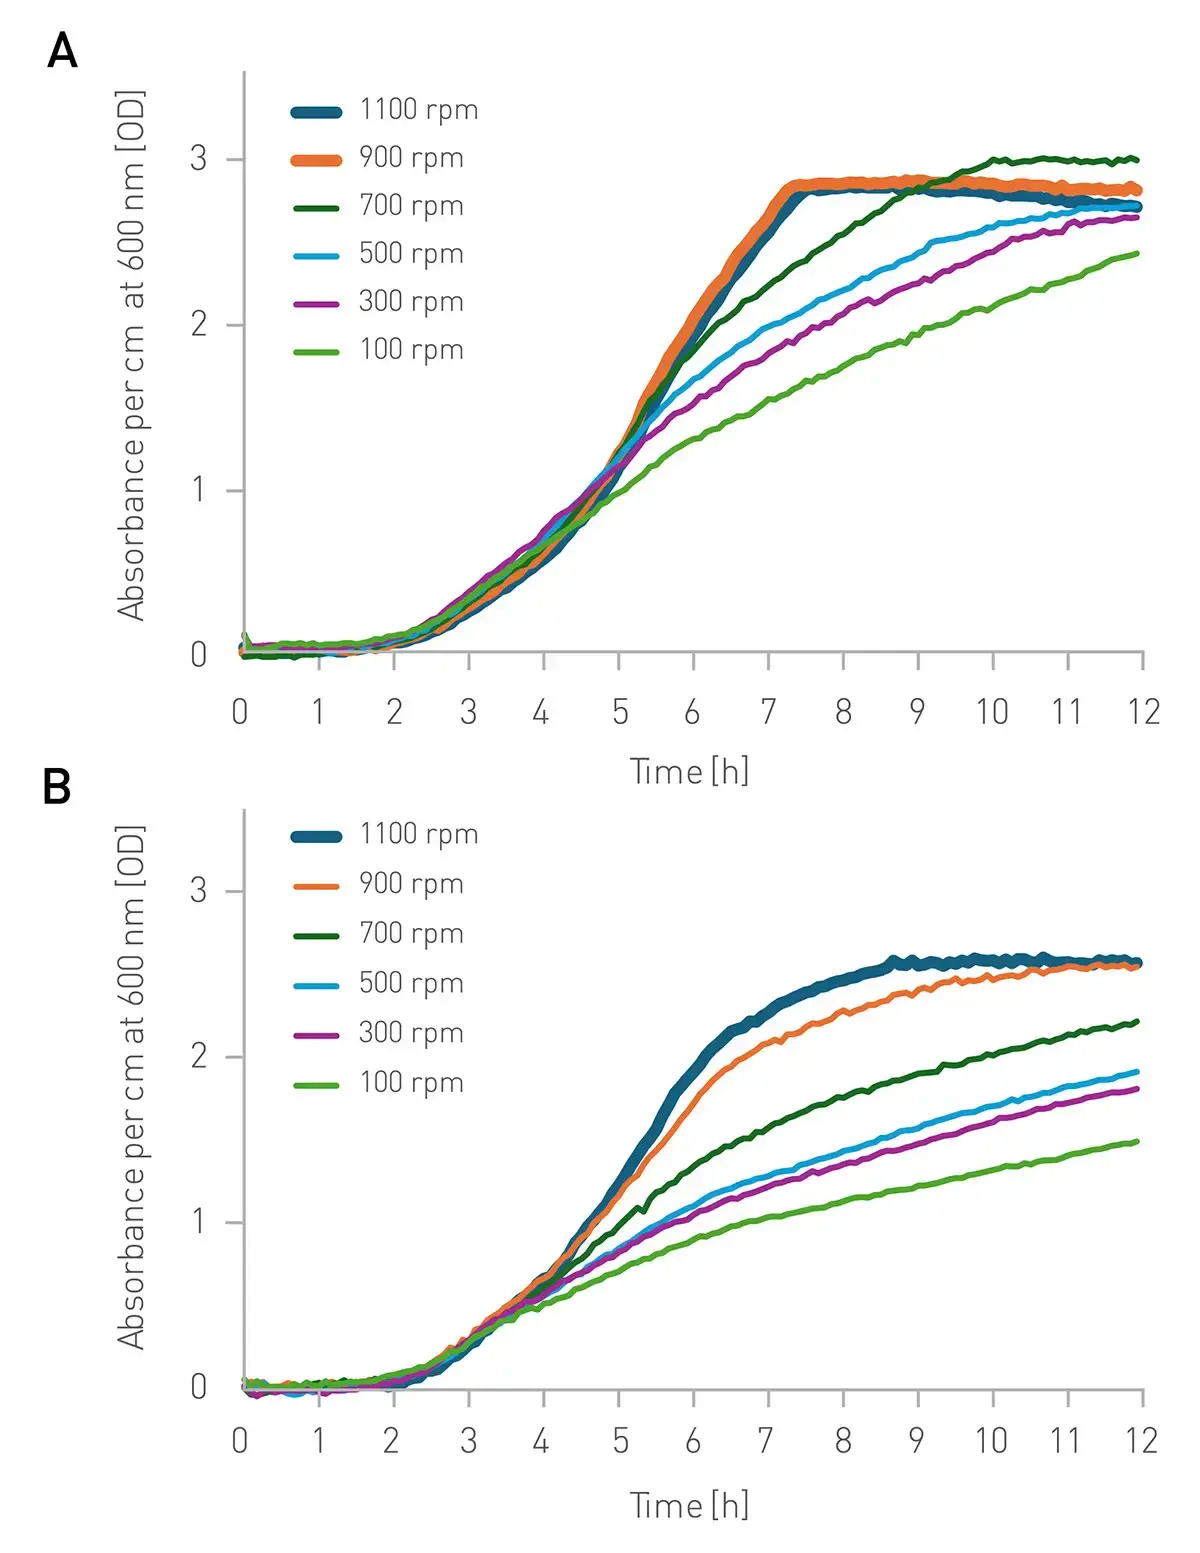
While higher shaking frequencies can reduce measurement time by enhancing oxygenation and nutrient mixing, excessive shaking can also stress or damage certain microbes. Therefore, the optimal frequency must balance these factors for each organism and experiment. Also note that the maximum proliferation rate is not always desirable and that the optimum speed can be different for each application.
The effects of the shaking frequency also depend significantly on the volume used. Figure 1B shows the same experiment. However, 300 μL/well were used instead of 100 μL/well used in fi gure 1A. In larger volumes, such as 300 µL, the increased path length and distribution of microbes cause a slower increase in OD values. The larger volume requires higher shaking frequencies to maintain optimal gas exchange and nutrient distribution. Here, the higher shaking frequencies show a further improvement, which no longer appears to have any effect with 100 μL/well (Fig. 1A).
In addition to the shaking frequencies, the applied shaking pattern can also have a significant influence on the growth rate of microbes. Figure 2 shows the growth curves of E. coli cultures, incubated over 12 h with 300 µL/well in a 96-well plate and 300 rpm shaking in between readings using orbital or double orbital shaking patterns. Double orbital shaking led to a faster increase in OD600 values compared to orbital shaking and thus to more effective mixing of the microbial suspension.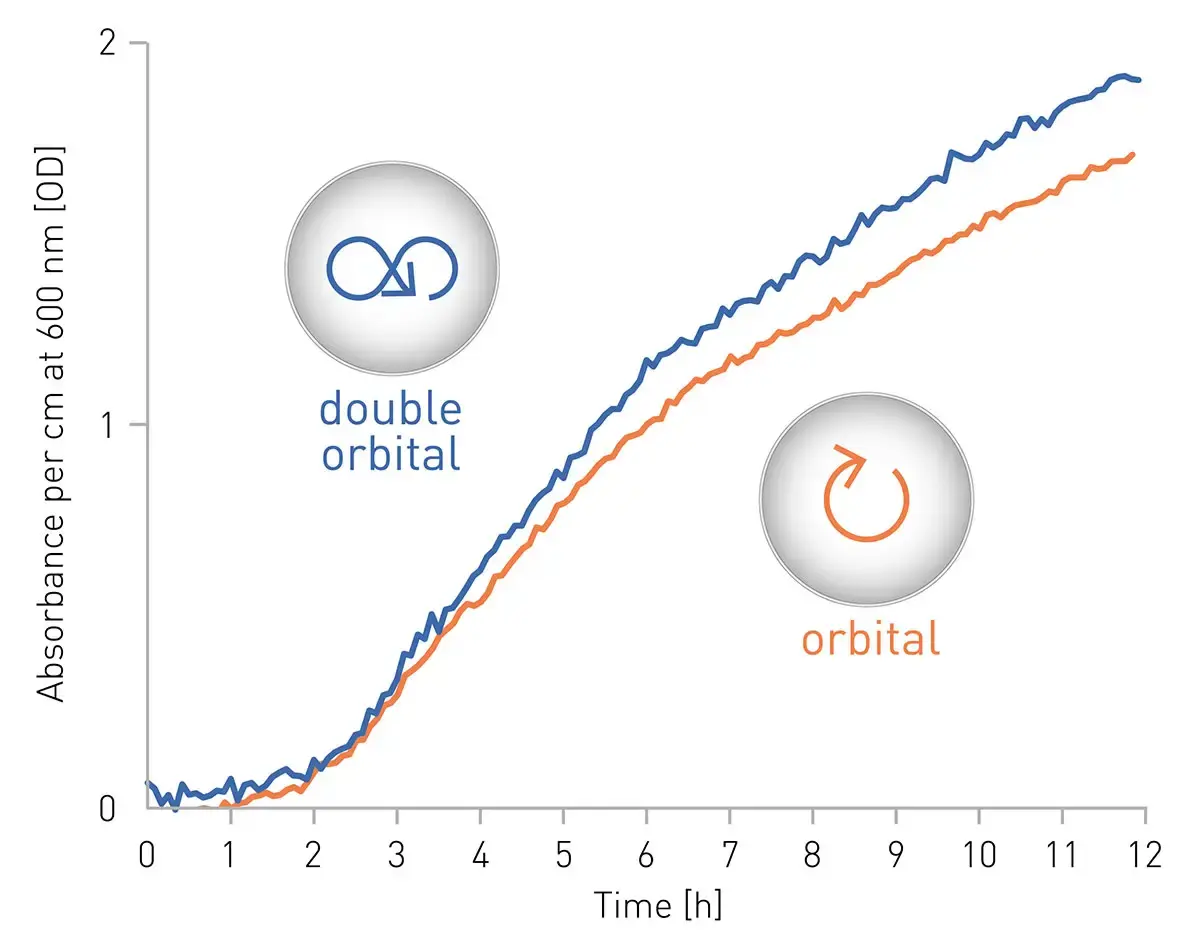
Did you know?
BMG LABTECH microplate readers also offer different shaking patterns like linear shaking, orbital shaking or double orbital shaking.
Another influencing factor is the size of the microbes to be examined. While bacteria like E. coli show an average diameter of only 0.75 µm, yeasts like S. cerevisiae are 5-10 µm in diameter, which is about ten times the size. This not only means that a smaller number of yeasts already leads to a higher OD600, but also manifests itself in different physical properties. Thus the optimal conditions for one organism do not necessarily apply to others. The parameters must be individually adapted and optimized for each microbe.Use well scanning options to reduce data variability
Even typical suspensions of cells, which normally remain isolated in the medium, cluster together from time to time. Such aggregates usually have little effect on the growth of the culture. With constant shaking, they usually break up again over time and access to nutrients remains available for all cells. Unfortunately, no effect on growth does not necessarily mean that there is no effect on the measurement results. Several flashes are made in the centre of the well during a conventional absorbance measurement. The absorbance values that are measured for each individual flash are then averaged into one final value per well. Cell aggregates in the light path can cause spurious increases in OD readings. If the aggregate moves in between measurements, the measured OD value can drop signifi cantly in the next run. The result: spiky curves and high data variability (Fig. 3A).
Well-scanning options mitigate this by measuring absorbance across multiple points, distributing the effect of aggregates over a broader surface area, which smooths out fluctuations and improves the accuracy of the overall measurement. (Fig. 3B).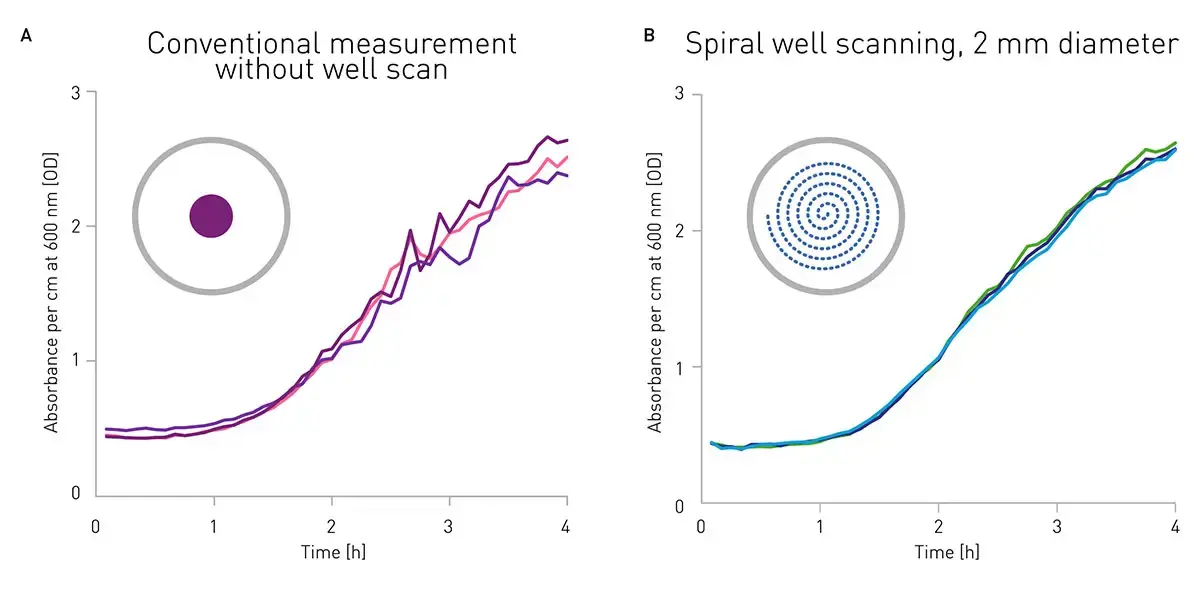
Did you know?
When measuring with BMG LABTECH microplate readers you can choose between centred measurements, spiral averaging, orbital averaging or also matrix scans.
Avoid evaporation
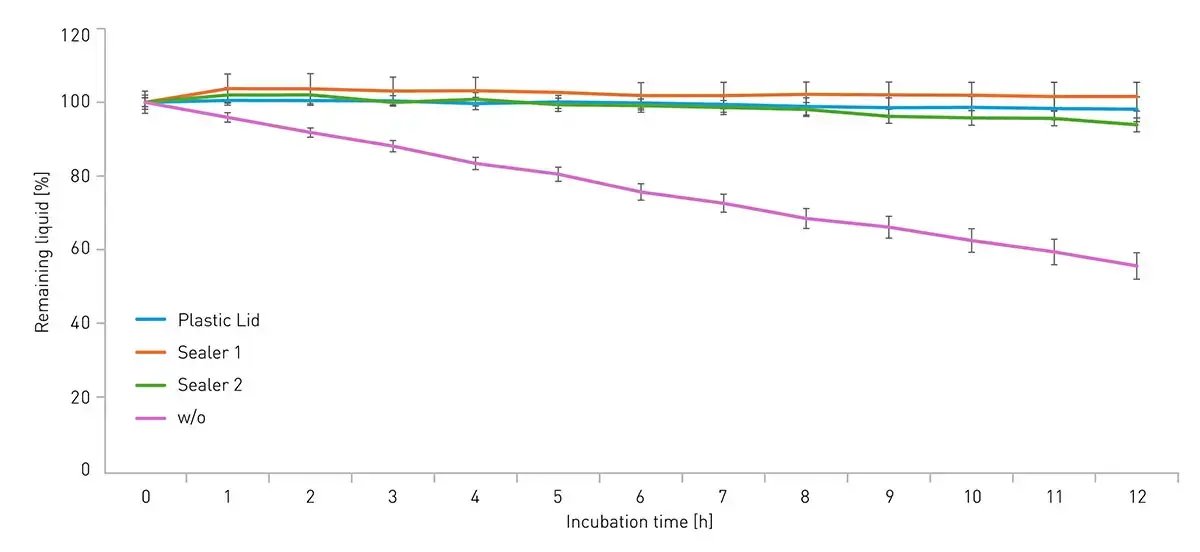
Evaporation increases with temperature and has a negative effect on OD600 measurements. Water is removed from the system through evaporation, which means that the osmolarity of the medium surrounding the microbes can change beyond the optimum level. This can lead to a reduced growth rate and even death of the organisms. As the optimum growth temperature of many microbes is often well above 30 °C, evaporation of the liquid in the well can never be completely avoided. However, you can prevent the evaporated liquid from leaving the well by using sealers or lids (Fig. 4).
Match reader and material temperature
When humid and warm air meets a cold surface, the water in the air condenses on it and forms liquid droplets, a process known as condensation. This is exactly what happens when a plate containing microbes is transferred from an incubator at 37 °C to a reader at room temperature (RT; 20-25 °C). Condensation on the microplate lid or sealer can scatter light, artificially increasing OD readings. Figure 5 shows the OD values at 600 nm of a sealed plate containing only LB broth in all wells. The OD values increase immediately after the preheated microplate is inserted into the reader and reach a maximum after about 20 min. In the subsequent period, the condensed water removes itself due to dropping of the water droplets into the well and by evaporation. The natural recovery process took about 4 h in total.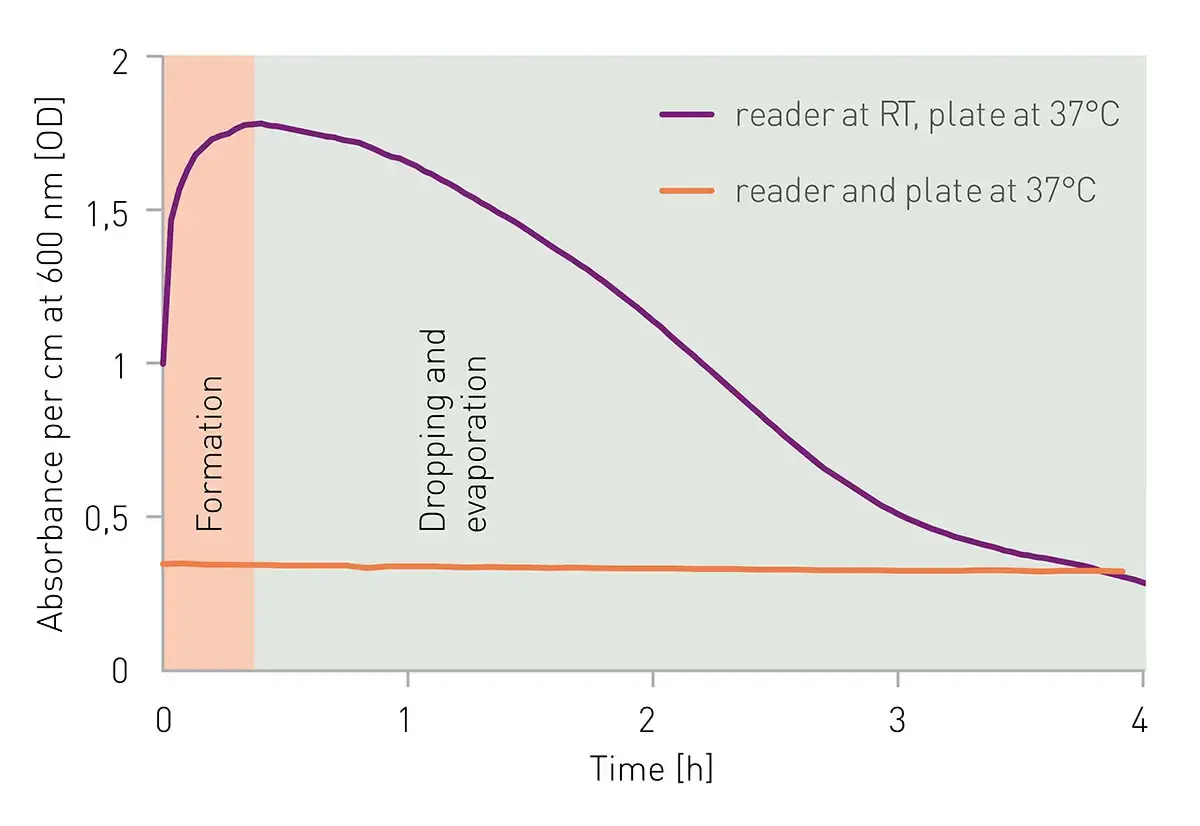 Caution is also required the other way round. Even if a plate at RT is placed in the preheated reader, there is a certain transition period until temperature-related effects on the OD values have levelled off. Ensuring that both the plate and reader are at the same temperature before measurements begin prevents condensation, leading to more accurate readings. Temperature equilibration is particularly important in experiments involving rapid temperature shifts.
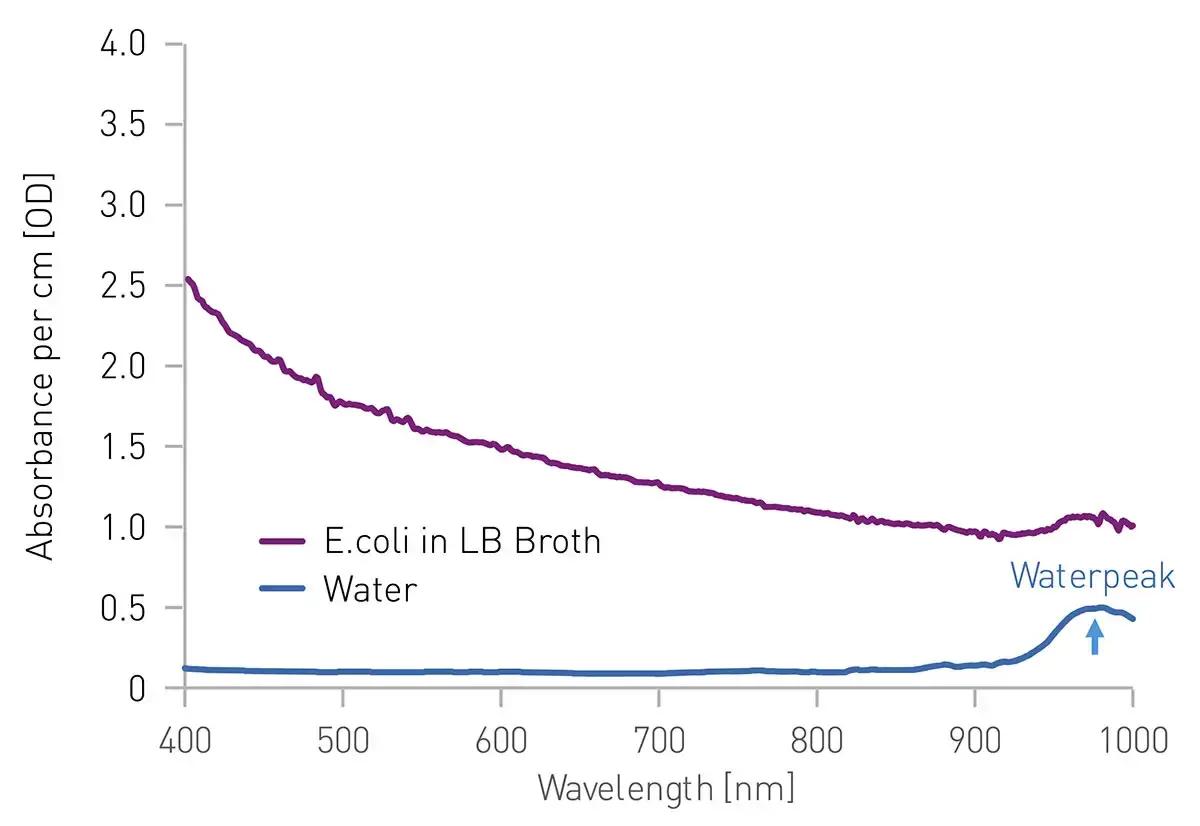
Do not use waterpeak-based path length correction
Water shows a natural absorbance peak at about 970 nm (Fig. 6). Since this peak is found at a wavelength where most analytes do not show any absorbance, it can be used to determine the path length of an aqueous sample and normalize the obtained absorbance values to the fill volume regardless of meniscus. However, this method of path length correction is problematic when measuring OD600. Light scattering by microbes occurs across a broad range of wavelengths, including 600 nm and 1000 nm. Because scattering interferes with absorbance measurements at 1000 nm, using waterpeak-based path length correction can lead to inaccurate OD600 values. Instead, a volume-based correction method, which accounts for well dimensions, is recommended. If plate dimensions and the used volume are available, the path length is calculated and applied by the software. This option is not affected by light scattering.
Conclusion
Each recommendation in this guide addresses specific challenges in OD600 measurements, such as minimizing data variability, avoiding evaporation, and optimizing growth conditions.
By adjusting shaking patterns and frequencies, using well scanning, and ensuring temperature consistency, researchers can achieve more accurate and reproducible OD600 results.
- Initial recommendation
- Detailed Recommendation