One of the first steps to consider when planning an experiment on a microplate reader is the selection of wavelengths and bandwidths. This is true for all
assays and applications that involve absorbance, fluorescence or luminescence measurements.
Analytes that can be measured on a microplate reader will absorb light at different wavelengths, and in the case of fluorescence emit light at different wavelengths. With luminescence there is only emitted light, but this too can vary in the range of wavelengths where emitted light can be detected.
Did you know?
Absorbance spectra of analytes can be collected with all BMG LABTECH microplate reader equipped with a spectrometer. In addition, emission spectra can be obtained on all BMG LABTECH readers equipped with LVF Monochromators.
Analytes are therefore typically defined by excitation and/or emission spectra specific to that compound. Selecting appropriate wavelengths and bandwidths specific for your analyte can minimise interference from other compounds in the sample that might absorb or emit light at similar wavelengths. Fig 1 shows an example of a typical fluorophore that we would like to use to illustrate the effect of wavelength and bandwidth selection on measurement results. 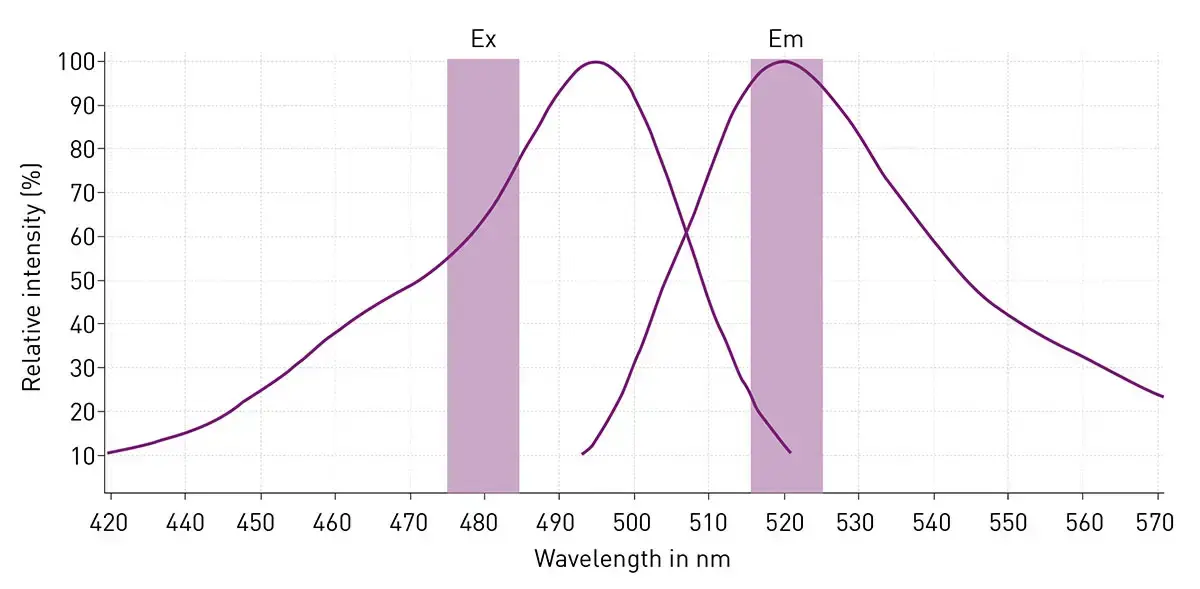
Setting wavelengths and bandwidths of your measurement exactly to the spectral maxima of an analyte is not always possible. This is due to the fact that for best measurement results in fluorescence, excitation and emission wavelengths should be set at least 30 nm apart. Closer than this and often signal-to-blank ratios can increase and the assay becomes less sensitive.
On a microplate reader excitation and emission wavelengths are determined using either filters or a monochromator. If you are working with a filter-based microplate reader each filter transmits light only at a fixed specific wavelength and bandwidth range, limiting the options immediately available to you. In contrast to filters, monochromators allow you to more freely select measurement wavelengths and bandwidths. BMG LABTECH’s fluorophore tool box will warn you if your monochromator settings are too close.
Did you know?
BMG LABTECH offers an extensive library of filters for excitation and emission that cover wavelengths from commonly used assays to more exotic applications. In addition, the LVF Monochromators on the VANTAstar® and CLARIOstar® Plus allow free selection of wavelengths from an extensive wavelength range.
Choosing an appropriate wavelength for measurement depends on the analyte and assay conditions. In general, choosing wavelengths closer to the spectral maxima of an analyte is beneficial to improve assay sensitivity as highlighted in figure 2. In this fluorescence example, choosing an appropriate wavelength for excitation of the fluorophore was particularly important to achieve the lowest LOD (figure 2A). Since the fluorophore used in these experiments has a relatively broad emission spectrum, while the same is also true of the emission wavelengths the effects are not so pronounced (figure 2B). Different analytes may exhibit different spectral profiles which do not allow such a range of wavelengths to be used. Additionally, the emission comparisons in fig 2B were recorded with an already optimised excitation wavelength.
Wavelength settings close to excitation and emission maxima of a fluorophore provide better sensitivity. To highlight this, we prepared a standard curve for the fluorophore shown in figure 1 and determined the limit of detection (LOD). The LOD is the lowest fluorophore concentration that can be distinguished from the assay background, using different wavelength settings. For excitation (figure 2A) the lowest and best limit of detection was achieved by using the wavelength closest to the excitation maximum of the fluorophore, 480 nm, combined with a fixed emission wavelength of 520 nm. Moving away from the excitation maximum of the fluorophore resulted in a significant loss in sensitivity. The same was true for emission measurements (figure 2B). Here, a fixed excitation wavelength of 480 nm was used. The lowest LOD was achieved using an emission wavelength setting of 520 nm close to the maximum of the fluorophore emission spectrum. 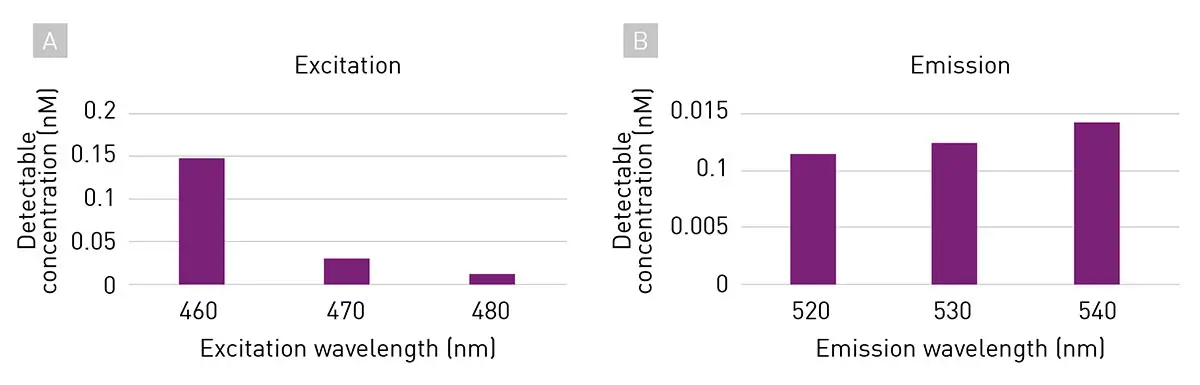
For fluorophores, it is important to note that emission signal intensities can also be increased by increasing the number of flashes of the light source in the microplate reader. This allows selection of the excitation wavelength away from the spectral maxima when necessary while still maintaining stable emission signal intensities.
Bandwidth is another crucial parameter when setting up a measurement protocol. Bandwidth describes the wavelength area covered by a filter or monochromator setting. For example, a 460-nm filter with a bandwidth of 10 nm transmits light in the wavelength range between 455 and 465 nm. Broader bandwidths mean light transmission over a larger wavelength range which can be beneficial or detrimental for measurement results depending on the assay. The effects of bandwidth selection on our fluorophore example are highlighted in figure 3. Here the lowest and best LOD was achieved by using bandwidth settings of 10 to 20 nm for both excitation (figure 3A) and emission (figure 3B).
Did you know?
The bandwidth setting can be freely adjusted from 8 to 100 nm in 1-nm increments when using BMG LABTECH‘s patented LVF Monochromators.
After identifying the ideal measurement wavelengths according to LOD calculations (figure 2), further measurements were performed using these wavelengths combined with different bandwidth settings. Again, a fluorophore standard curve was measured and the lowest fluorophore concentration that can still be distinguished from the assay background was determined. LOD was determined using excitation settings of 480 nm with varying bandwidths and a fixed emission setting of 520 nm with 10-nm bandwidth (figure 3A). Alternatively, a fixed excitation at 480 nm with 10-nm bandwidth combined with an emission wavelength of 520 nm with varying bandwidths was used (figure 3B). For the tested fluorophore, bandwidths in the range of 10 to 20 nm gave the lowest LOD for excitation as well as emission wavelengths of approximately 11 pM. Using bandwidths that are too narrow or too wide may result in a loss of sensitivity depending on the analyte and assay components. The increase to higher LODs by using bandwidths below and above the optimum was more pronounced for the emission wavelength indicating non-specific emission background in these wavelength ranges.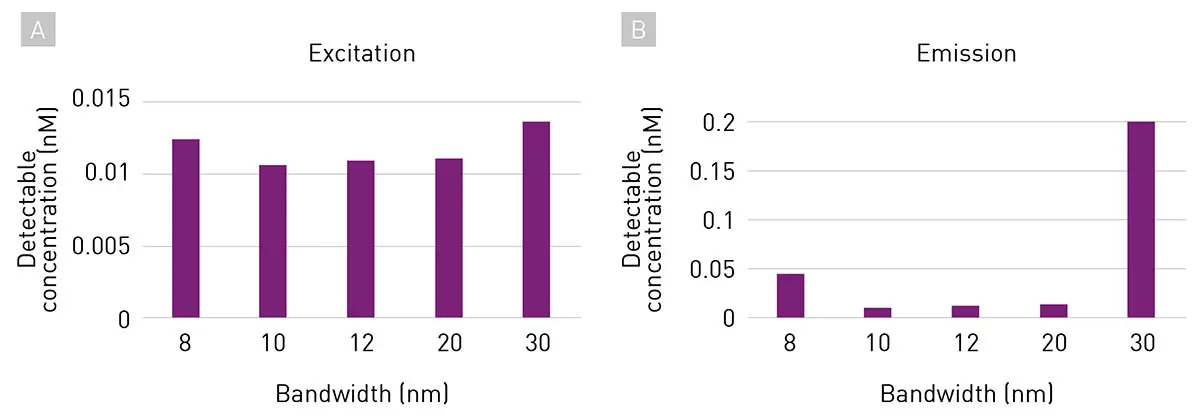
Ultimately, the ideal bandwidth range for measurement depends on the application. For excitation wavelengths, shorter bandwidth ranges are in many cases beneficial. They avoid exciting other assay components that may otherwise generate background signals. For emission wavelengths, broader bandwidths can be beneficial when the measured analyte stably emits light over this bandwidth range. This can be useful when overall signal levels are relatively low. However, selecting a broader bandwidth for emission can also mean that the resulting measurement range not only covers the emission spectrum of an analyte but also emission signals derived from other assay components including autofluorescence potentially reducing LODs. For such applications, selecting a narrower bandwidth can be beneficial. When using fluorophores that emit light in the red end of the spectrum or reading luminescent signals, background is typically lower allowing for wider bandwidths.
In this example, a commonly employed luminescence test was used to highlight the influence of bandwidths on the performance of luminescence-based applications. For this purpose, a luciferase standard solution was prepared and measured at 560 nm with bandwidths ranging from 10 to 100 nm (figure 4). A signal to blank (S/B) ratio was calculated from the measurement data of luciferase samples and buffer solution without luciferase substrate and used as a parameter for assay sensitivity. In this example, the best S/B ratio was achieved using a bandwidth of 60 nm.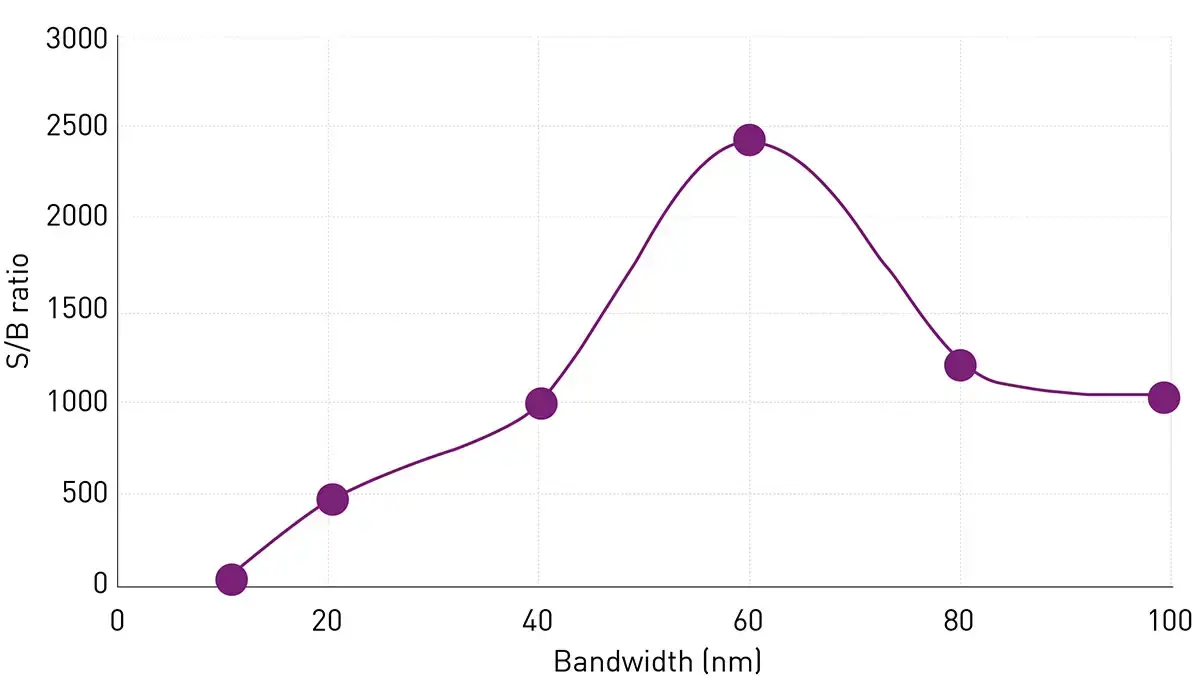
In comparison to fluorescence-based readouts, absorbance- and luminescence-based measurements have different requirements for wavelength and bandwidth selection. Many absorbance-based microplate readers are equipped with spectrometers that allow absorbance to be measured with very narrow bandwidth ranges. Since many absorbance signals are very specific, broader bandwidths are not needed and may even be detrimental for data quality. In contrast, luminescence is defined by sample signals that cover a broad wavelength range. If only a single luminophore is present in a sample, luminescence can be recorded without selecting a specific measurement wavelength or bandwidth on a microplate reader. This maximises signal acquisition with comparatively low background signals for luminescence assays. However, wavelengths and bandwidths may need to be defined when other analytes are present besides the luminophore. While luminophores generally benefits from broader bandwidth ranges due to the above reasons there can also be an optimal measurement bandwidth depending on the luminophore (figure 4).
Conclusion
- Identifying maxima of excitation and emission spectra of analytes improves data quality and the sensitivity of your measurements.
- Appropriate wavelengths and bandwidths maximise the ability to distinguish between analyte signals and the assay background.
- With appropriate wavelength and bandwidth settings, multiplexing of multiple analytes in the same sample is possible.
- Initial recommendation
- Detailed Recommendation