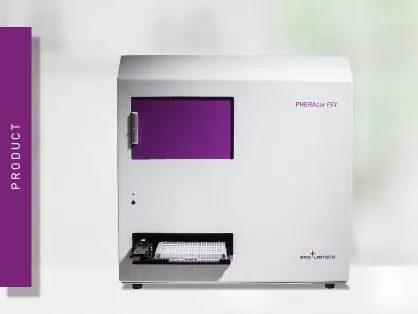
PHERAstar FSX
Powerful and most sensitive HTS plate reader


Detect flash and glow bioluminescent signals with high sensitivity, from reporter gene studies to ATP quantification.
The word luminescence is composed of “lumin” (Latin for light) and the suffix “-escence” (used for processes or changes). It is hence a process in which light is released. Per definition, luminescence stems from cold sources and is differentiated from emission from heated sources (incandescence) such as hot iron or a burning candle1. Luminous signals can be generated during energy conversion from a broad range of energy sources. The process turns invisible energy into visible radiation and can be used in nature as a defence mechanism, for LEDs on screens, or for analysis purposes. The content of this page focuses on the use of luminescence methods in life sciences, explains their physical background, provides information on its detection on luminescence microplate readers, and presents common luminescence microplate assays. Electroluminescence, radioluminescence and thermoluminescence are not part of this content as not relevant to this topic.
Luminescence is the production of a luminous signal through energy conversion. Its application in the life sciences primarily relies on two energy sources: chemical or luminous energy, leading to chemi- and photoluminescence, respectively. The latter is also the basis of fluorescence (phosphorescence).
The energy of one of the two sources is absorbed by a molecule and brings its electrons to a higher energy level (Fig. 1). As this level is unstable, the electrons fall back from the excited to the ground state. When falling back, electrons release energy in form of vibrational energy, heat, and photons. The latter is the luminescent emission2.
In life sciences, “fluorescence” is commonly used when talking about phosphorescence or photoluminescence while “luminescence” typically refers to chemiluminescence. This simplification is supported by the difference in detection: fluorescence requires an excitation source whereas luminescence does not (Fig. 2). This content adheres to this common nomenclature and concentrates on chemiluminescence, following referred to as “luminescence”.
In this reaction, a substrate reacts in an electronically excited state. The electrons of the excited product or intermediate fall into their lowest energy state by emitting photons, hence being luminescent. A typical example is the reaction of luminol in the presence of hydrogen peroxide (Fig. 3). In an alkaline environment, this substrate exists in a form (Dianion) that reacts with molecular oxygen O2. The oxidized intermediate then reacts to an electronically excited 3-Aminophthalic acid (3-APA). The molecule then drops back to the energy state it normally occupies and releases light. This simple principle is also the basis for enhanced chemi- and bioluminescence. Thus, both are chemiluminescent reactions as well.
ECL uses enhancers in its chemiluminescent reaction. ECL mainly employs luminol in conjunction with hydrogen peroxide. However, the oxidation is catalysed by an enzyme: horseradish peroxidase (HRP). Additionally, ECL reactions contain chemicals that enhance the light production such as p-coumaric acid or 4-iodophenylboronic acid. The use of an enzyme to catalyse the chemical reaction enables ECL to be used in enzyme-linked reactions. Its major application is in immunoblots: proteins are separated by size, transferred onto a membrane, and detected by ECL. The proteins of interest immobilized on the membrane are bound by a protein-specific antibody. A second, horseradish peroxidase-coupled antibody is used to link the protein-antibody with the enzyme. Thanks to enzymes and enhancers, a bright signal is generated only where the protein is found.
The same principle is employed for microplate-based quantification of biomolecules. ELISA assays with a luminescent readout have a higher sensitivity and are based on ECL. The protein of interest is immobilised on the microplate well and specific antibodies, HRP-coupled secondary antibody, substrate, and enhancer generate a luminous signal that increases with protein concentration.
Bioluminescence occurs in living organisms. The term also covers reactions using enzymes and substrates originally derived from living organisms, though being used outside the organism, or bio-engineered to provide improved characteristics. Bioluminescence is used for different biological purposes. Fireflies use their ability to glow to attract mates. Jellyfishes such as Aequorea victoria or deep-sea shrimps are thought to use light production to ward off biological enemies. During quorum sensing, bacteria such as the marine Vibrio fischeri generate a luminous signal when they reach a certain density. This allows the population to communicate and coordinate.
How do these organisms manage to luminesce? By an enzyme (luciferase) that catalyses the oxidation of substrates (luciferins) and thereby releases photons. Different organisms utilise different enzymes and substrates. Furthermore, the light-emitting reactions require different co-factors and result in varying wavelengths. Figure 4 shows three reactions of widely used luciferases in life science assays.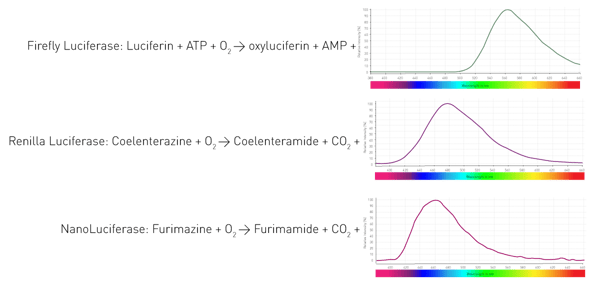
Resonance energy transfer describes the transfer of energy from an electronically excited donor molecule to an acceptor fluorophore. The process excites the acceptor fluorophore which in turn emits photons. In case, the donor energy is generated by bioluminescence, the process is called bioluminescence resonance energy transfer (BRET). Various conditions must be met to allow the transfer: the emission spectrum of the donor molecule needs to overlap with the excitation spectrum of the acceptor fluorophore. Additionally, donor and acceptor need to be in proximity (typically 1-10 nm), as the transfer decreases with distance. Consequently, BRET is commonly used to measure the interaction of two biomolecules. The output of BRET is the intensity of the acceptor fluorophore related to the intensity of the donor, known as BRET ratio. BRET1, BRET2 and NanoBRET use different combinations of enzymes and acceptor fluorophores as shown in table 1.
Table 1 – Types of BRET
| Name | Donor luciferase | Substrate | Donor emission | Acceptor fluorophore | Acceptor emission |
| BRET 1 |
Renilla |
Coelenterazine |
450-500 nm |
YFP | 515-560 nm |
| GFP |
510-540 nm | ||||
| BRET 2 | Renilla | DeepBlueC | 400-450 nm | GFP | 500-540 nm |
| NanoBRET | NanoLuc | Furimazine | 420-500 nm | NanoBRET 618 | 550-675 nm |
| TMR | 550-600 nm | ||||
| AlexaFluor 633 | 600-700 nm | ||||
| Venus | 515-575 nm |
Luminescence-based assays for life science applications either use flash or glow reactions. The difference between the two is the duration of their signal. Flash assays produce a signal for a maximum of a couple of seconds. The intensity of the produced light flash is typically recorded directly from the start to the end of the reaction. This implies, flash reactions need to be started by the addition of a reaction starter. On microplate readers, reagent injectors are needed to automatically start the reaction and record the signal simultaneously. Popular flash luminescence assays are the Dual-Luciferase Reporter™ technology or SPARCL assays.
In contrast to flash, glow luminescence generates stable signals for up to hours. The assays do not require automatic dispensing and can be read over a longer time span. Researchers, as well as kit providers, tend to prefer glow assays as they are easier to handle and detect. One of the most prominent representatives of glow-luminescence is the viability test CellTiterGlo®.
Apart from ECL-detection in western blots, luminescence tests typically employ microplates (6 to 1536-well formats) and are quantified using a microplate reader. This section explains how luminescence is measured in microplates.
Luminescence is easier to detect than fluorescence or absorbance as no excitation is required. This means neither a light source, nor an excitation wavelength selection are required. The minimum components needed are a lens to collect the luminous signal and a detector (Fig. 5). A wavelength selection tool is required to measure BRET and light guides may be necessary for specific detection constructions. 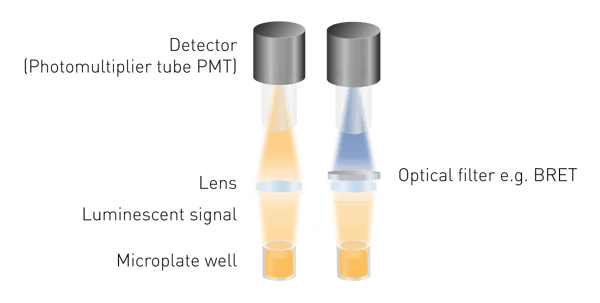
Photomultiplier tubes (PMTs) serve as detectors in luminescence detection. PMTs differ in their sensitivity (the lowest detectable signal), their noise, and their capability to measure other detection modes. Many measurement devices come with a universal PMT that reads luminescence as well as other detection modes. Their advantages are low space and cost requirements despite providing high sensitivity. The possibility to measure very low signals is provided by optimised optical systems. Such an optimized system is the free-air optical path combined with a luminescence plus optic module found in PHERAstar FSX microplate readers.
Dedicated PMTs for luminescence detection provide either a lower noise or the use of a photon-counting principle. While both dedicated PMTs can detect low signals as well, a photon counting system is limited in detecting higher signals (Fig. 6).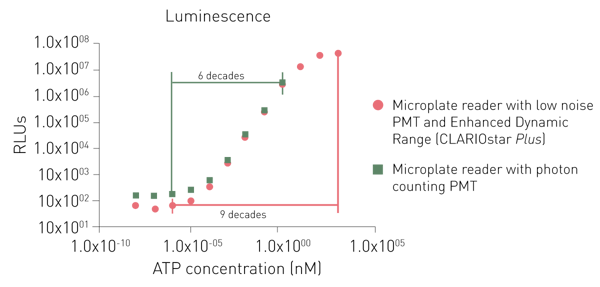
Ideally, the detector is placed directly above the well. If this is not possible, the luminous signal needs to be guided from the well to the detector. This task can either be performed by lenses and mirrors or by a light guide. The guide absorbs some of the luminescence which decreases sensitivity compared to a free air optical path. The latter can be found on VANTAstar, CLARIOstar Plus, and PHERAstar FSX microplate readers.
Some applications require to detect only at a specific wavelength for optimal results. This is accomplished by optical filters or monochromators placed in the optical path. BRET measurements need wavelength selection as two signals come from one and the same sample. To distinguish between light coming from the donor and from the acceptor fluorophore two filters are required.
Conventional grating-based monochromators play a subordinate role in filtered luminescence and BRET measurement because of limited sensitivity. This is due to scattering effects and narrow bandwidths. However, a monochromator technology using Linear Variable Filters (LVF) provides the needed sensitivity. An LVF-based monochromator exhibits filter-like transmission and provides bandwidths up to 100 nm. This assures enough signal reaches the detector for filtered luminescence such as BRET (Fig. 7).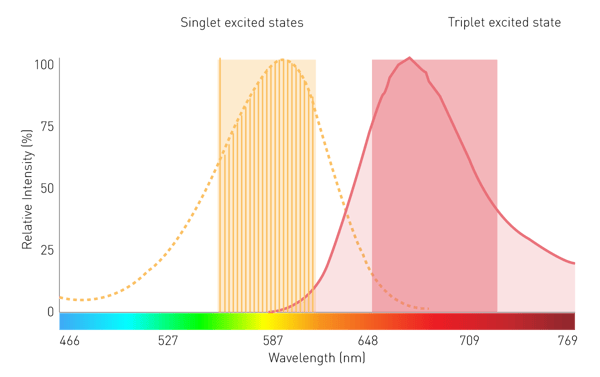
A luminescent signal lasts a second or longer and is therefore clearly different from fluorescence that decays in nanoseconds. Accordingly, the signal is typically detected over a time period between 0.1 - 1 seconds. This time has different names: measurement time, integration time, and measurement interval time. It depends on several aspects that have to be balanced against each other such as signal intensity and total time to read a plate.
Luminescence detection in microplate readers is relatively easy as it typically requires fewer settings. However, there are instrument-related and general variables that impact measurements and data quality.
As stated above, the acquisition time depends on several factors. The following aspects should be considered when choosing the integration time:
Most assays emit enough light that a signal can be detected in half a second to 0.02 seconds. Only very rarely, it is necessary to increase the integration time up to a few seconds in order to detect differences in luminescence signals.
Glow signals are typically acquired for 0.1 - 1 seconds, as they emit a stable signal. Therefore, the total plate read time, as well as the timing and duration of signal measurement, play minor roles. This is different in flash assays. Here, it is important to collect the complete emission signal from start to end, which can be several seconds, depending on the assay.
If it is important to know what the signal curve looks like and what the maximum emission of a flash reaction is, multiple measurements at very low integration times are necessary. For instance, if a reaction takes approximately one second, 50 measurements of 0.02 s can be performed to cover one second and monitor how the signal develops and decays.
This point is of relevance only for kinetic measurements. In case a cell-based or biochemical reaction is monitored with a luminescent assay, the time course of the reaction dictates the integration time. For instance, in calcium assays responses occur in a range of 20 seconds after stimulation and can be displayed by 10 measurements every 2 seconds. If only one well is measured, an integration time of 1 or 2 s can be chosen and results in an appropriate temporal resolution. However, if more wells need to be read with the same temporal resolution (measurement point for each well every 2 seconds), the integration time needs to be reduced to measure the remaining wells and avoid loss of data.
As the integration time is applied to each well, it contributes largely to the total read time of a plate. Increasing the integration time on each well by only 0.2 s, increases the overall read time of a full 96-well plate by 20 s, of a 384 well plate by more than a minute. Therefore, it is important to use low integration times in high-density plates (384 or 1536 well plates) and in high-throughput applications where thousands of plates need to be measured in a day.
The gain can be regarded as an amplification factor that moves a fixed dynamic range window along the concentration curve of the sample. Low signal intensities require higher gains, whereas intense signals require lower gains. Usually, the gain is set to have a maximum measurement output on the sample with the expected highest intensity. This is done to have the largest possible dynamic window between the highest and the lowest measurement values. Hence, if positive controls with a maximum signal are used along with unknown samples, the gain can be adjusted on them.
The possibility to measure with different gains resulting in a large dynamic range allows for measuring very low signals and bright emissions with only one instrument.
Gain settings are not required for all luminescent microplate readers, depending on the detector and automation of the gain adjustment process.
Modern luminescence plate readers automatically accomplish gain adjustments. This not only takes away this responsibility from the researcher but also assures to measurement a broad dynamic range. Such instruments are the CLARIOstar® Plus and the VANTAstar® with its Enhanced Dynamic Range technology.
White plates are best suited for luminescence detection as they reflect the signal instead of absorbing it. You can find more details on the plate choice in our blog post: "The microplate: utility in practice."
Importantly, if a luminescent and a fluorescent assay are combined in the same well, a black plate is preferred. Fluorescence measured in a white plate leads to very unstable values and very high background signal because of the reflection of excitation light. This makes fluorescence detection in white plates quite problematic. Measuring luminescence in black plates reduces the assay window. However, as the background is highly reduced and measurements exhibit lower deviations, the measurements should still give satisfying results.
Cross-talk is the light from any but the measured well that is unspecifically measured by the detector and modifies the signal of the actual measured well. It is a phenomenon only affecting luminescence detection.
Since the light produced in a luminescent reaction is diffuse, it may not only shine directly above the well but also stray to neighbouring wells and directly to the site of detection, even though another well is measured. This leads to biased signals, higher variation, and to a lower overall sensitivity. The problem can be solved by different means, depending on the reaction type and on the diffusion of the signal.
For flash assays that only shine for a few seconds, it is sufficient to measure the plate in a different order. As the signal decays quickly, the only wells affected by cross-talk are the adjacent ones when measured directly after each other. If a distant well instead of an adjacent one is measured, the cross-talk is drastically diminished as the decaying signal is not detectable at the distant site. For this purpose, BMG LABTECH microplate readers offer an interlaced reading mode. This mode measures every other well until the end of the plate is reached. Then the omitted zones are measured. This allows the signals measured first to decay until their direct neighbours are measured.
Glow tests emit stable signals for hours and require other strategies to eliminate cross-talk. Undesired signals can reach the detection site in two ways: above the plate and through the wall of the wells (Fig. 8). Both ways need to be approached differently.
Apertures physically block the unwanted light that shines over the wells into the detector. An aperture is a black spoon-shaped accessory with a hole in it that is placed above the microplate (Fig. 8). Through the hole, the signal of the well of interest reaches the detector, while all light coming from its surrounding is physically blocked. BMG LABTECHs multi-mode microplate readers PHERAstar® FSX, as well as VANTAstar® and CLARIOstar® Plus, come with apertures for improved luminescence detection.
Light can shine through the plastic wall of a well, even in white microplates. The type of microplate significantly affects cross-talk shining through the walls of a plate. Generally, higher density plates (e.g., 1536 wells) display higher light leakage through the walls than lower density plates, as the walls are thinner. A second aspect is well geometry: square wells have a higher through-the-wall-cross-talk because adjacent wells share a wall. Round wells do not share the wall and, hence, display lower cross-talk through the wall. Furthermore, the colour of the plate influences cross-talk through microplate walls: the darker the plate the lower the cross-talk. Grey plates offer a compromise between cross-talk reduction and signal reflection.
If it is not possible to further optimise the plate, a mathematical cross-talk reduction can be applied to the acquired data. To this end, the signal bleed-through to neighbouring wells is determined and an algorithm corrects the data. An automatic determination and cross-talk correction is found in the BMG LABTECH plate readers PHERAstar® FSX, VANTAstar®, and CLARIOstar® Plus.
White plates have an intrinsic phosphorescence: light is emitted by the plate itself after exposure to light. This signal can alter the data, increasing blanks and reducing the assay window. Hence, it is recommended to prepare the plate in the dark or to leave the plate in the dark approximately 15 minutes before measuring.
Filters are mainly needed for BRET measurements. As luminescence often exhibits low signal outputs, it is recommended to use filters with a broad bandwidth of 80 - 100 nm. Broader bandwidths result in more light coming through to the detector and increases the sensitivity of the measurement.
Reporter assays use gene regulatory sequences combined with the genetic information for a reporter molecule to study either change in gene expression or modifications in the regulatory region itself. The genetic information of the reporter gene needs to be introduced into cells. If the reporter gene is active, the enzyme is transcribed and translated. In presence of a substrate, it is converted, light is produced, and its emission reports on the activity of regulatory sequences.
The dual luciferase reporter assays (DLR™) add a second reporter to the system. Next to the one coupled to a regulatory sequence of interest, a second luciferase controlled by a “housekeeping” promoter serves as internal control. Using the CLARIOstar or the VANTAstar and their luminescence scanning option it is possible to identify matching luciferases and combine e.g. up to six luciferases in a single multiplexing luciferase assay.
The most popular viability assay is based on the firefly enzyme. Its activity increases with rising ATP levels and so does the light emission. Viable cells produce ATP, which after cell lysis fuels the reaction. Accordingly, emission correlates with cell number and viability. In addition to ATP-based endpoint viability assays, luminescent assays may measure cell viability in real-time. To this end, a pro-substrate, as well as the firefly enzyme are added to the cell culture. The pro-substrate is reduced only by viable cells and is then processed in a light-emitting reaction. This way, luminescence reports on viability changes in real-time. You can find out more about these assays in our scientific talk “Real-time cell health assays deliver better data with less effort”. Cell viability assays are also relevant to work with PROteolysis TArgeting Chimeras (PROTACs) and molecular glues in targeted protein degradation for drug discovery. This includes research involving targeted protein degradation arising from specific interactions between known degrons and ligases.

Cell metabolism encompasses different steps of molecular conversion. Many of the available assays to detect metabolic cellular pathways are luminescence-based. Basic metabolism focuses on the use of major nutrients such as glucose. Glucose consumption can be tracked for example by the glucose glo assay. For indirect measurement of glucose consumption, the breakdown product of glucose - lactate - can also be detected with the lactate glo assay. The performance of both assays is demonstrated in the application note: Glucose assay and lactate assay allow to monitor cellular glucose metabolism precisely in a cell-based assay. In the AppNote: ROS detection in a cell-based format using the Promega ROS-Glo™ assay, the use of a luminescence-based assay for the detection of excessively produced reactive oxygen species is shown.
Receptors are common drug targets and their ligands are possible therapeutics. The binding of ligands to their receptors can be studied in cell-based assays using the BRET principle. The luciferase is expressed at the extracellular part of the receptor and a ligand is labelled with a suitable acceptor fluorophore. If the ligand binds its receptor, donor and acceptor are close enough to transfer energy and the BRET ratio increases. The method further allows to study receptor binding of unlabeled compounds. These can compete for binding with a known ligand, labelled with a fluorophore. If the BRET ratio decreases in such a competitive setup, an unlabeled compound displaced the acceptor molecule leading to a loss of transfer (Fig. 9).
How these assays help to study receptor pharmacology is explained in our scientific talk “Real-time profiling of receptor pharmacology”.

The principle of BRET is also used to study interaction of two proteins. To this end, one of the interacting proteins is coupled to the luciferase, the other to an acceptor fluorophore. Upon interaction of both, transfer of energy occurs leading to fluorophore emission and an increase in BRET ratio. This can for example be used to study G-protein dissociation and β-arrestin recruitment. An alternative method to study interaction using luminescence is the HiBiT CETSA described in the application note: Measuring protein ligand binding with an endogenous HiBiT CETSA test system. This approach utilises a fragmented HiBiT nanoluciferase fused to a target protein of interest (POI) and can be used to screen for PROteolysis TArgeting Chimeras (PROTACs) and molecular glues in targeted protein degradation. This type of approach is also relevant to the study the targeted protein degradation arising from specific interactions between known degrons and ligases. While under physiological conditions the fragmented luciferase can be completed to form a functional enzyme with luminescent readout, the application of a heat prevents this effect due to denaturation of the POI. Binding of a ligand will increase the POI´s thermal stability, leading to a measurable shift of its melting point.
Next to protein-protein interaction, the BRET principle can also be employed for the detection of biomolecules, functioning as a biosensor. In this example, differential activation of G proteins by synthetic cannabinoid receptor agonists, utilizing the CAMYEL BRET biosensor was studied.
Luminescence microplate assays are often more sensitive than their counterparts based on other mechanisms. For instance, luminescent ELISAs and viability assays are more sensitive than colorimetric and absorbance-based assays, respectively. Furthermore, they offer solutions for a wide variety of biological questions. Due to their sensitive nature, they are highly used in low volumes in high-throughput applications. Instrumentation as sensitive as the method itself is necessary for its detection. An advantage for non-HTS use of luminescence is the availability of homogenous assays based on an add-and-measure principle which makes the assays easy and fast to process. Furthermore, a variety of real-time luminescent assays allow the quantification of cellular processes as they occur.
Powerful and most sensitive HTS plate reader
Most flexible Plate Reader for Assay Development
Flexible microplate reader with simplified workflows
Upgradeable single and multi-mode microplate reader series